Overview of Data Assets
OpenMetadata displays a single-pane view for each of the data assets. In the detailed view of a data asset, the Source, Owner (Team/User), Tier, Type, Usage, Description are displayed on the top panel. Further, there are separate tabs each for Schema, Activity Feeds & Tasks, Sample Data, Queries, Profiler & Data Quality, Lineage, Custom Properties, Config, Details, Features, Children, and Executions based on the type of data asset selected.
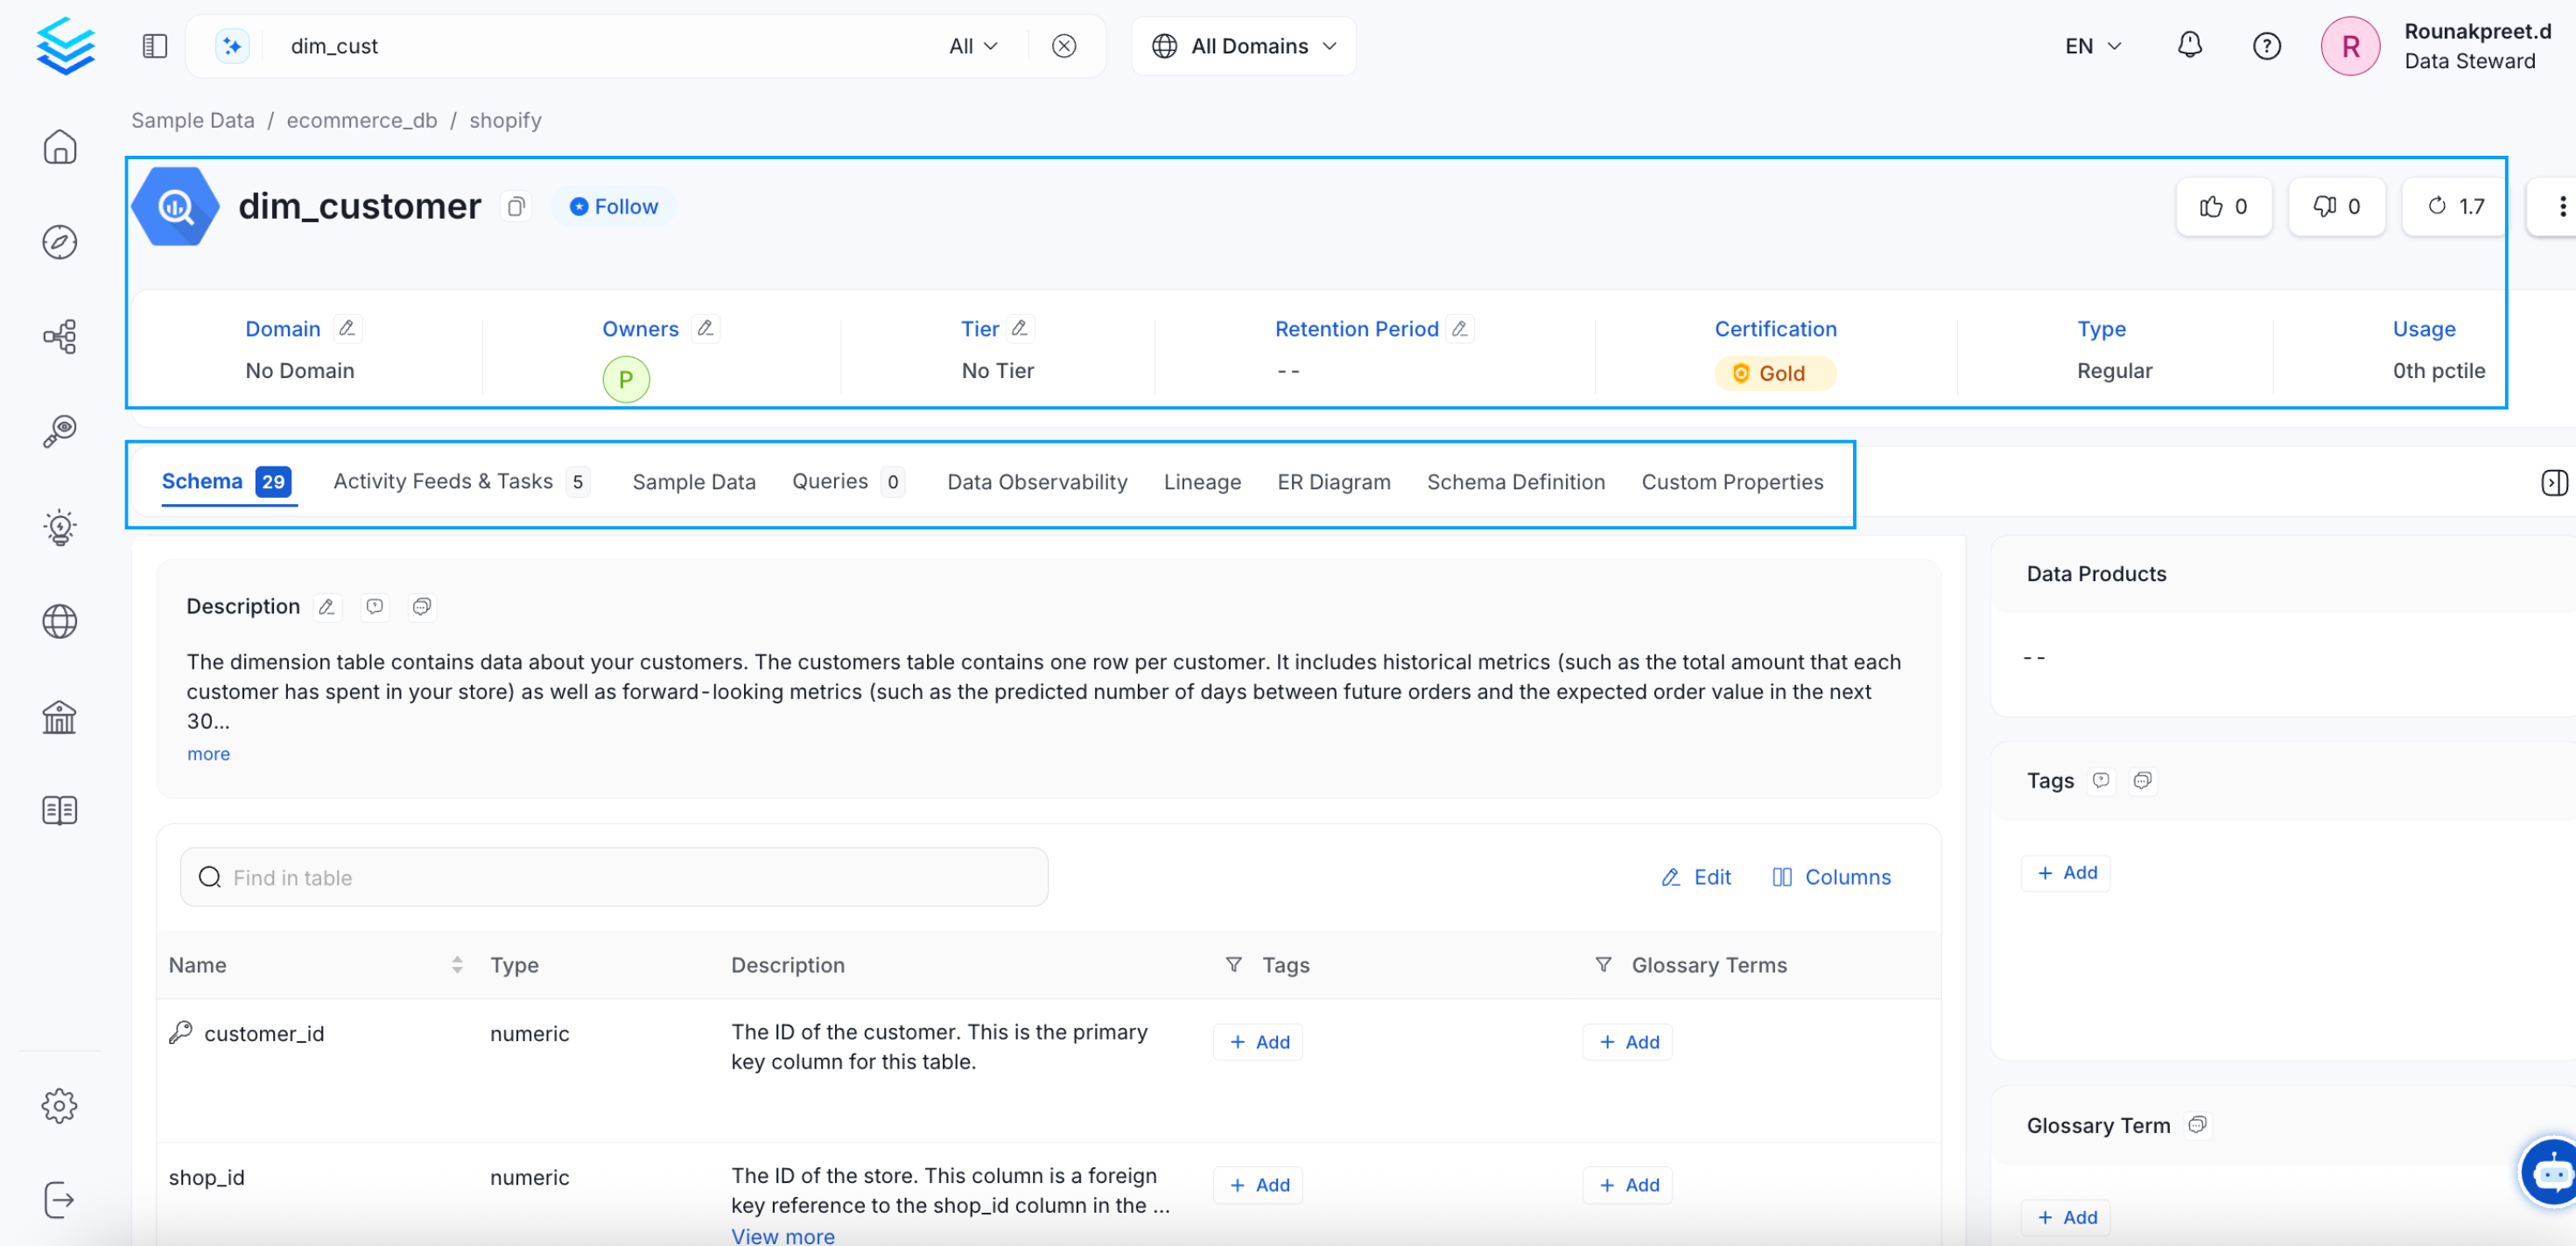
Overview of Data Assets
Data Asset Tabs
The data asset details page displays the Source, Owner (Team/User), Tier, Type, Usage, and Description on the top panel. There are separate tabs each for Schema, Activity Feeds & Tasks, Sample Data, Queries, Profiler & Data Quality, Lineage, Custom Properties, Config, Details, Features, Children, and Executions based on the type of data asset selected. Let's take a look at each of the tabs.
| TABS | Table | Topic | Dashboard | Pipeline | ML Model | Container |
|---|---|---|---|---|---|---|
| Schema | ||||||
| Activity Feeds & Tasks | ||||||
| Sample Data | ||||||
| Queries | ||||||
| Profiler & Data Quality | ||||||
| Lineage | ||||||
| Custom Properties | ||||||
| Config | ||||||
| Details | ||||||
| Executions | ||||||
| Features | ||||||
| Children |
Schema Tab
The Schema Data tab is displayed only for Tables, Topics, and Containers. Schema will display the columns, type of column, and description, alongwith the tags, and glossary terms associated with each column. The table also displays details on the Frequently Joined Tables, Tags, and Glossary Terms associated with it.
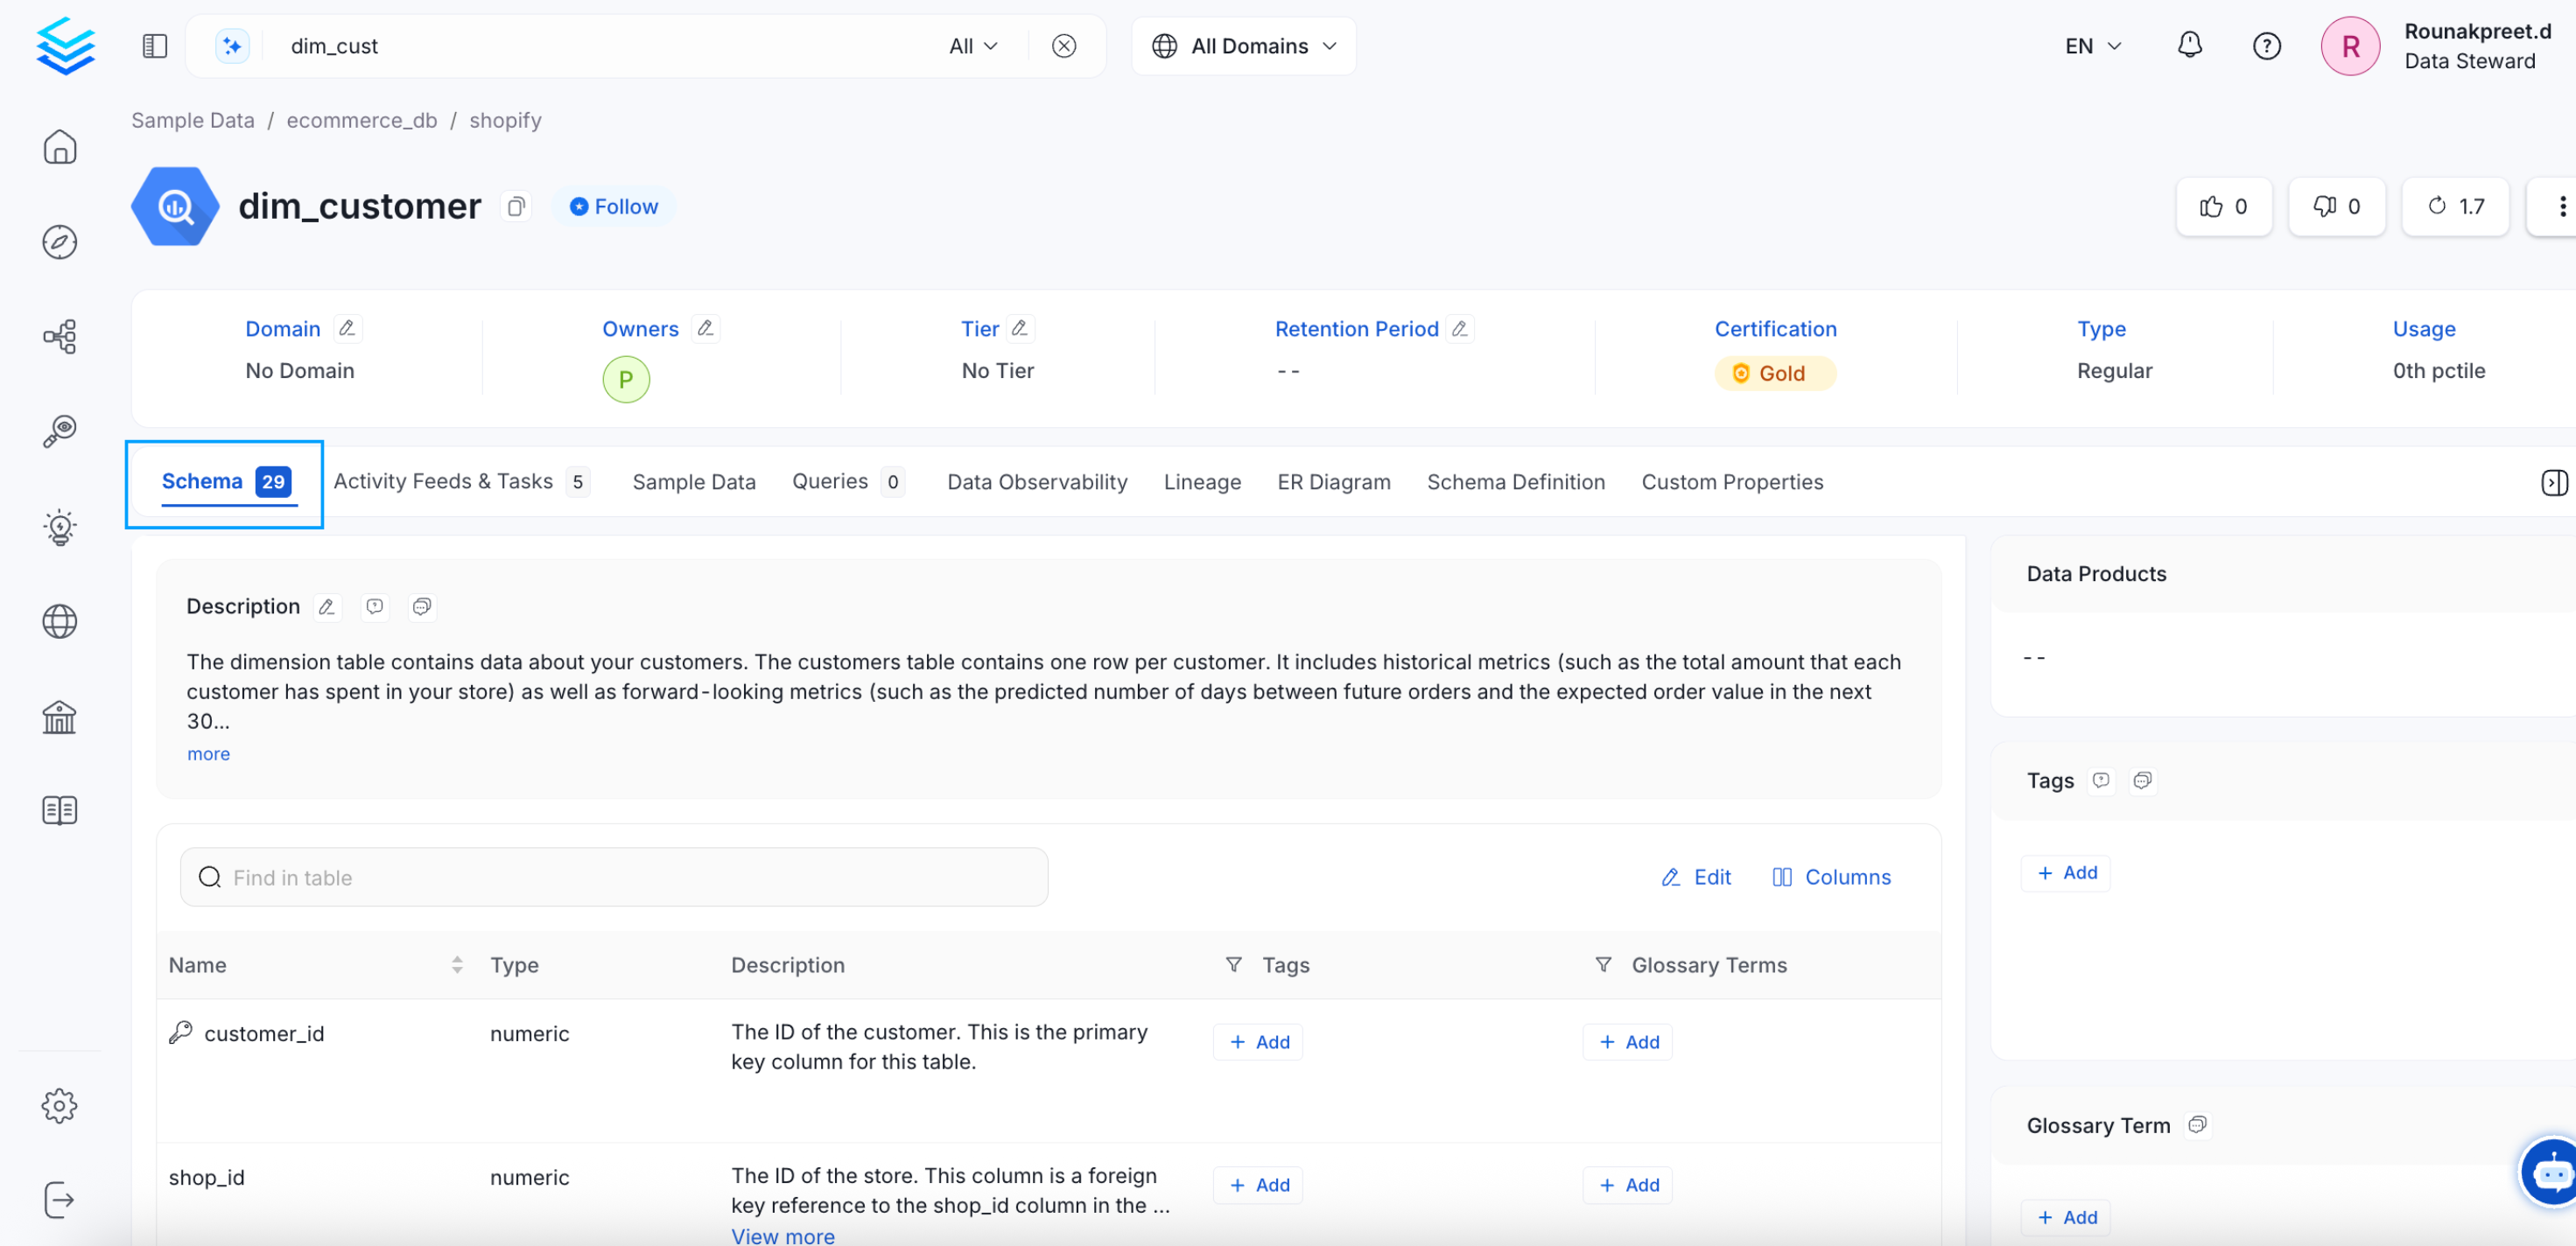
Schema Tab
Activity Feeds & Tasks Tab
The Activity Feeds & Task tab is displayed for all types of data assets. It displays all the tasks and mentions for a particular data asset.
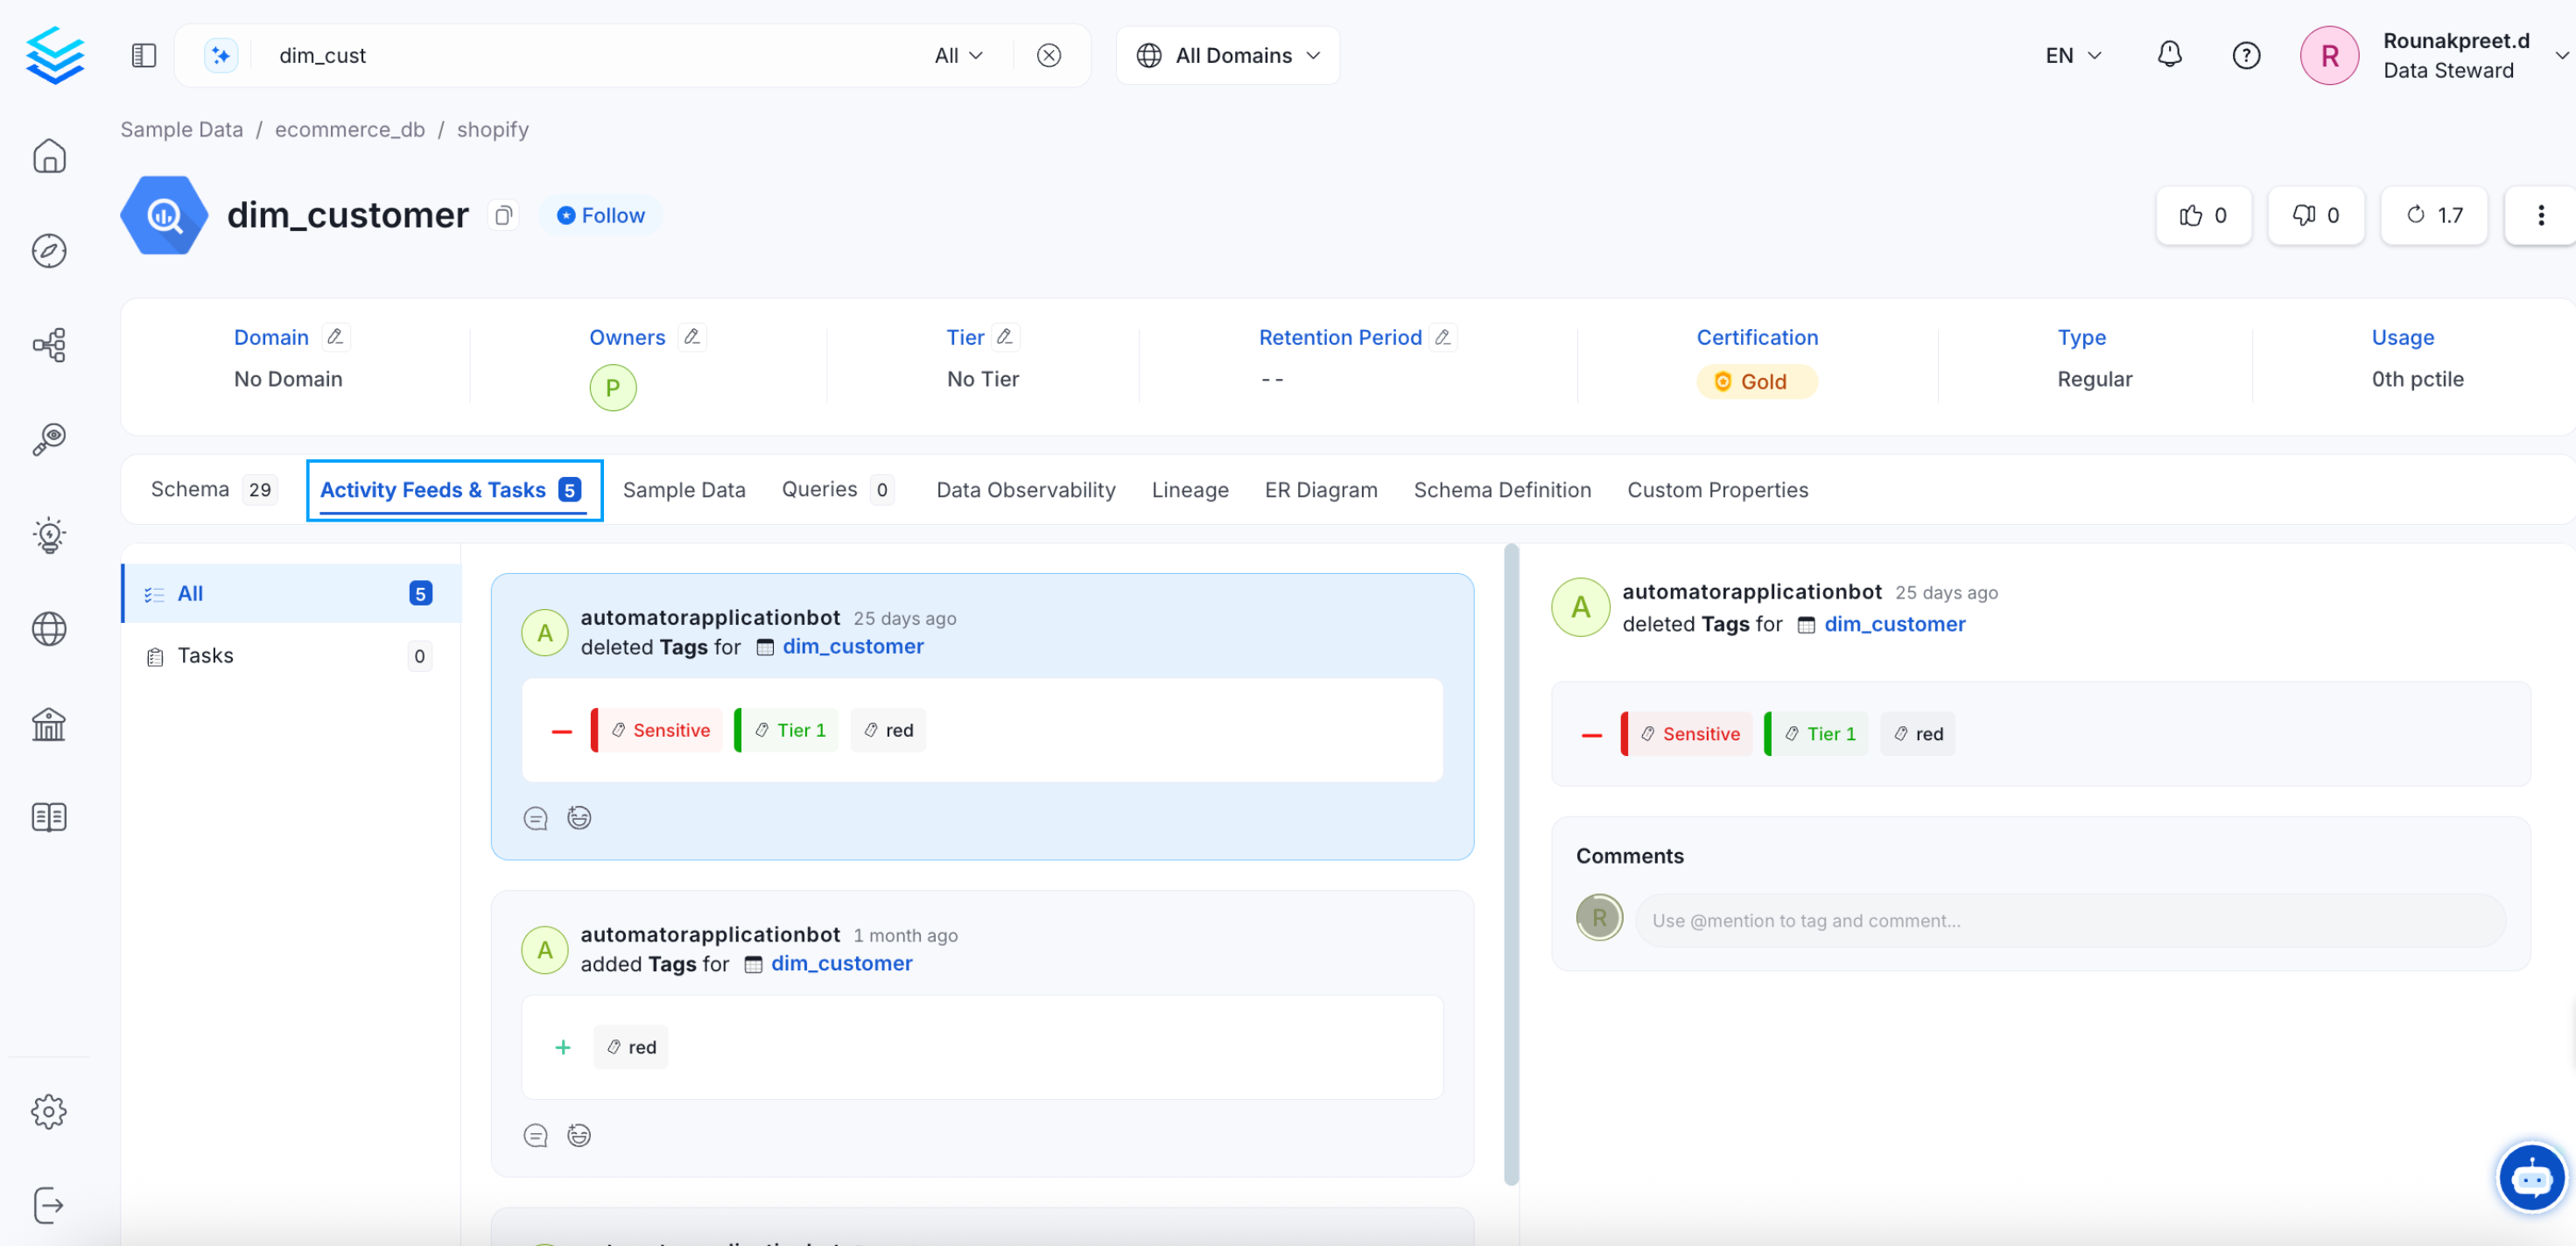
Activity Feeds & Tasks Tab
Sample Data Tab
During metadata ingestion, you can opt to bring in sample data. If sample data is enabled, the same is displayed here. The Sample Data tab is displayed only for Tables and Topics.
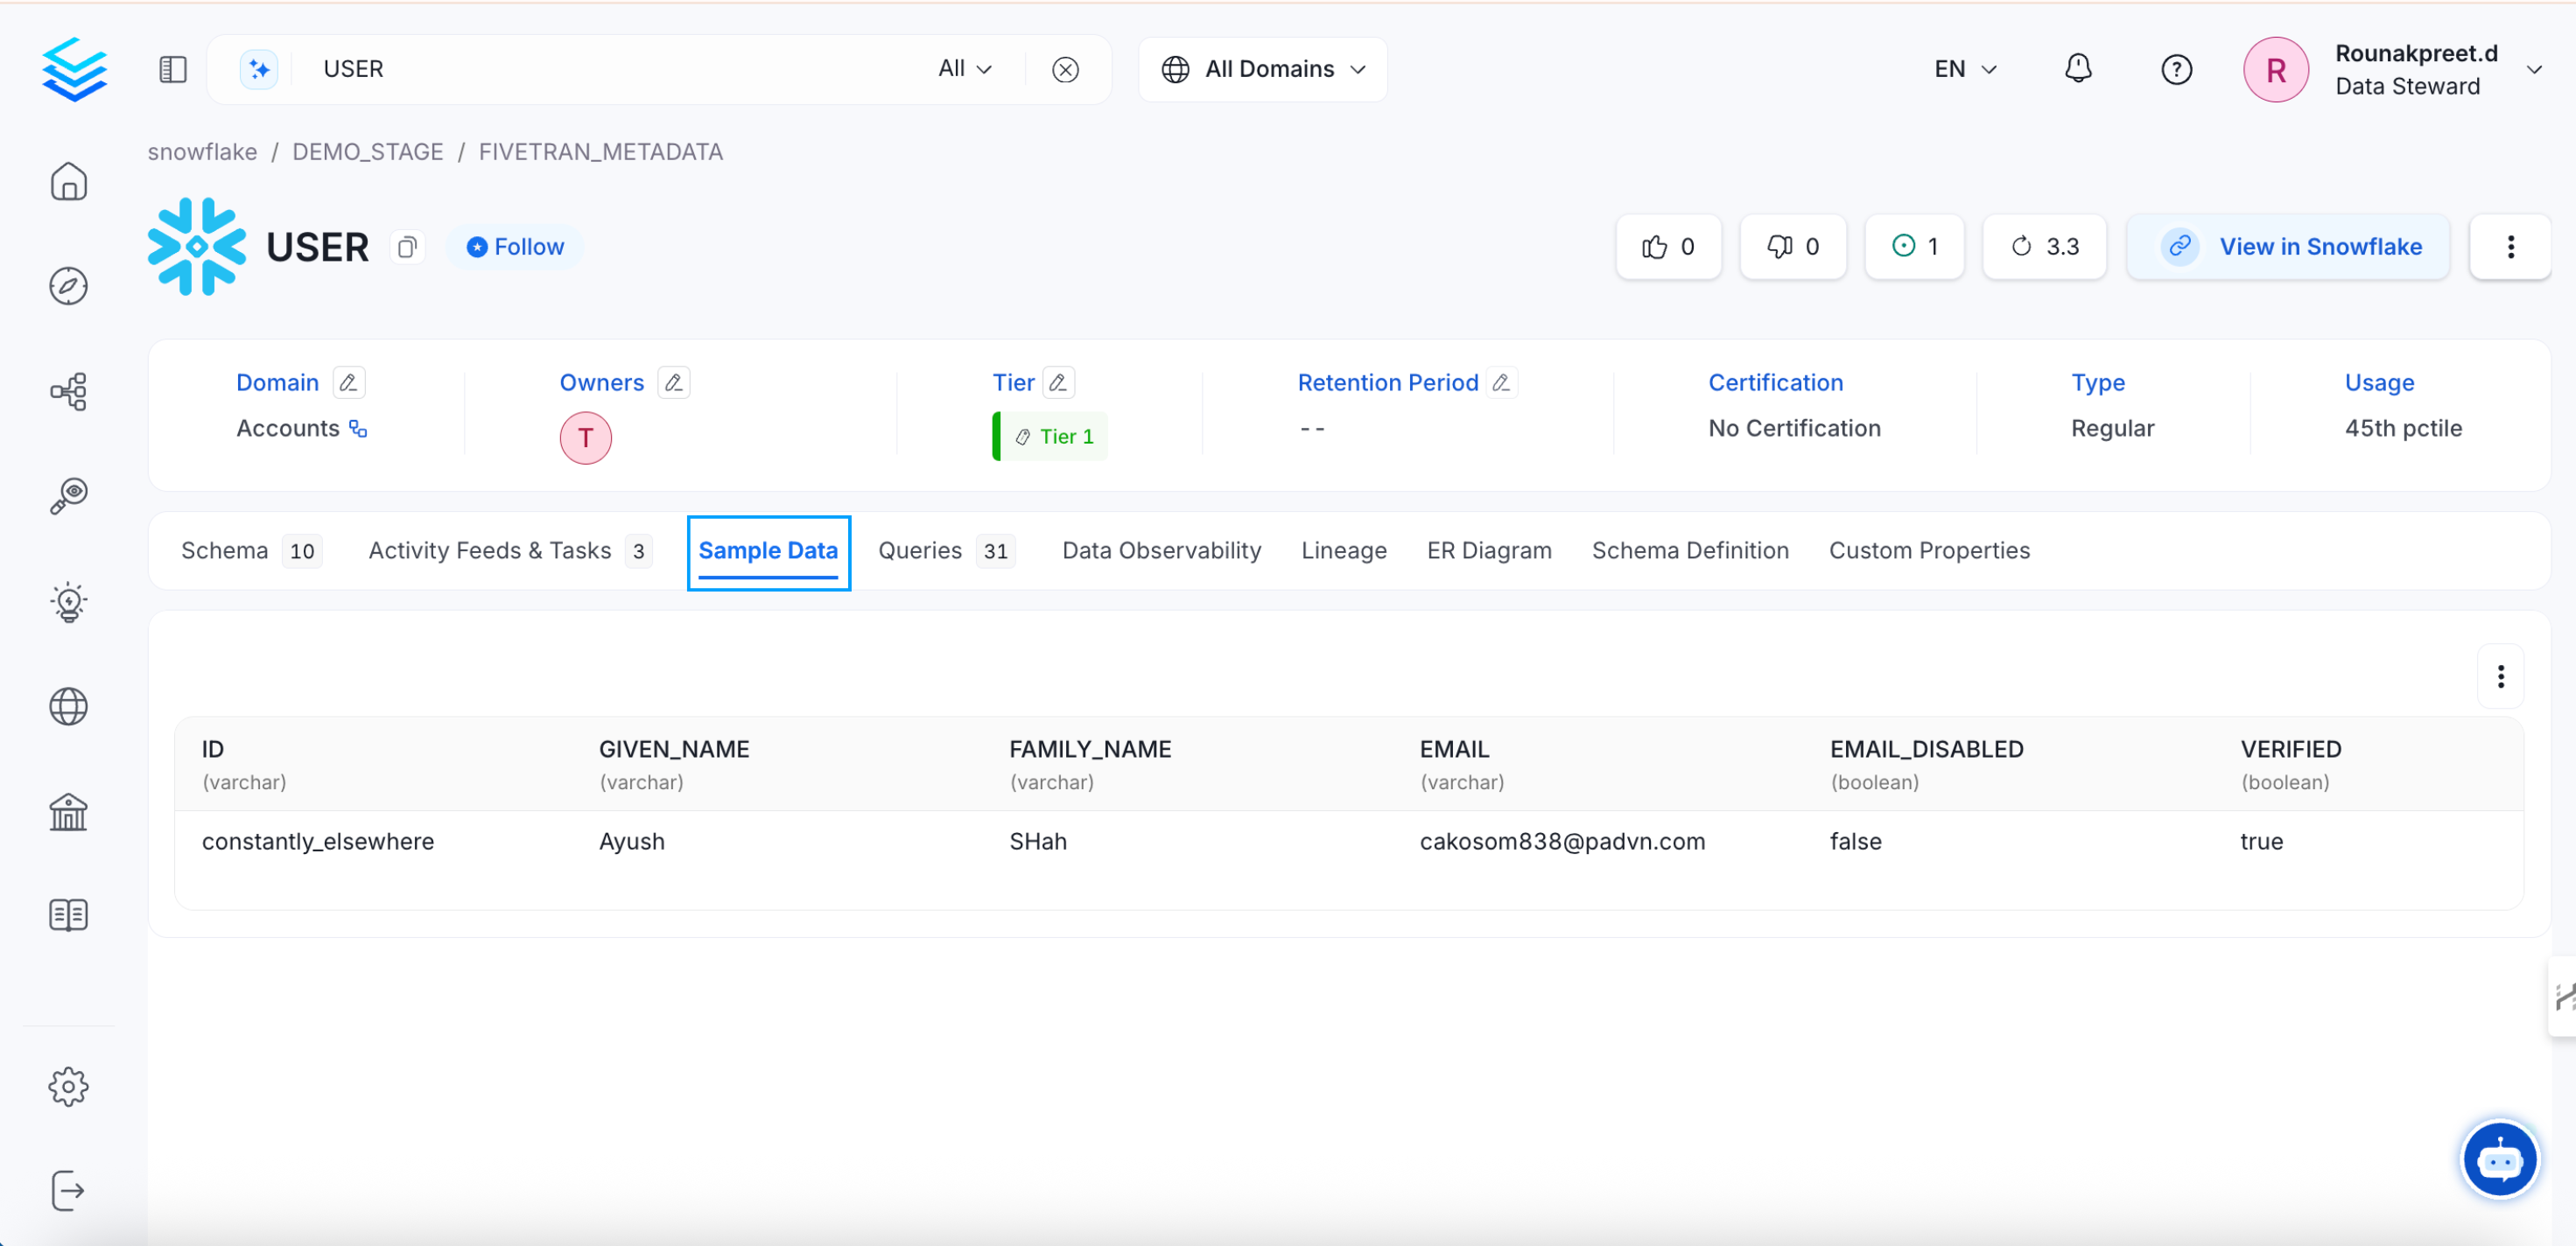
Sample Data Tab
Queries Tab
The Queries tab is displayed only for Tables. It displays the SQL queries run against a particular table. It provides the details on when the query was run and the amount of time taken. It also displays if the query was used by other tables. You can also add new queries.
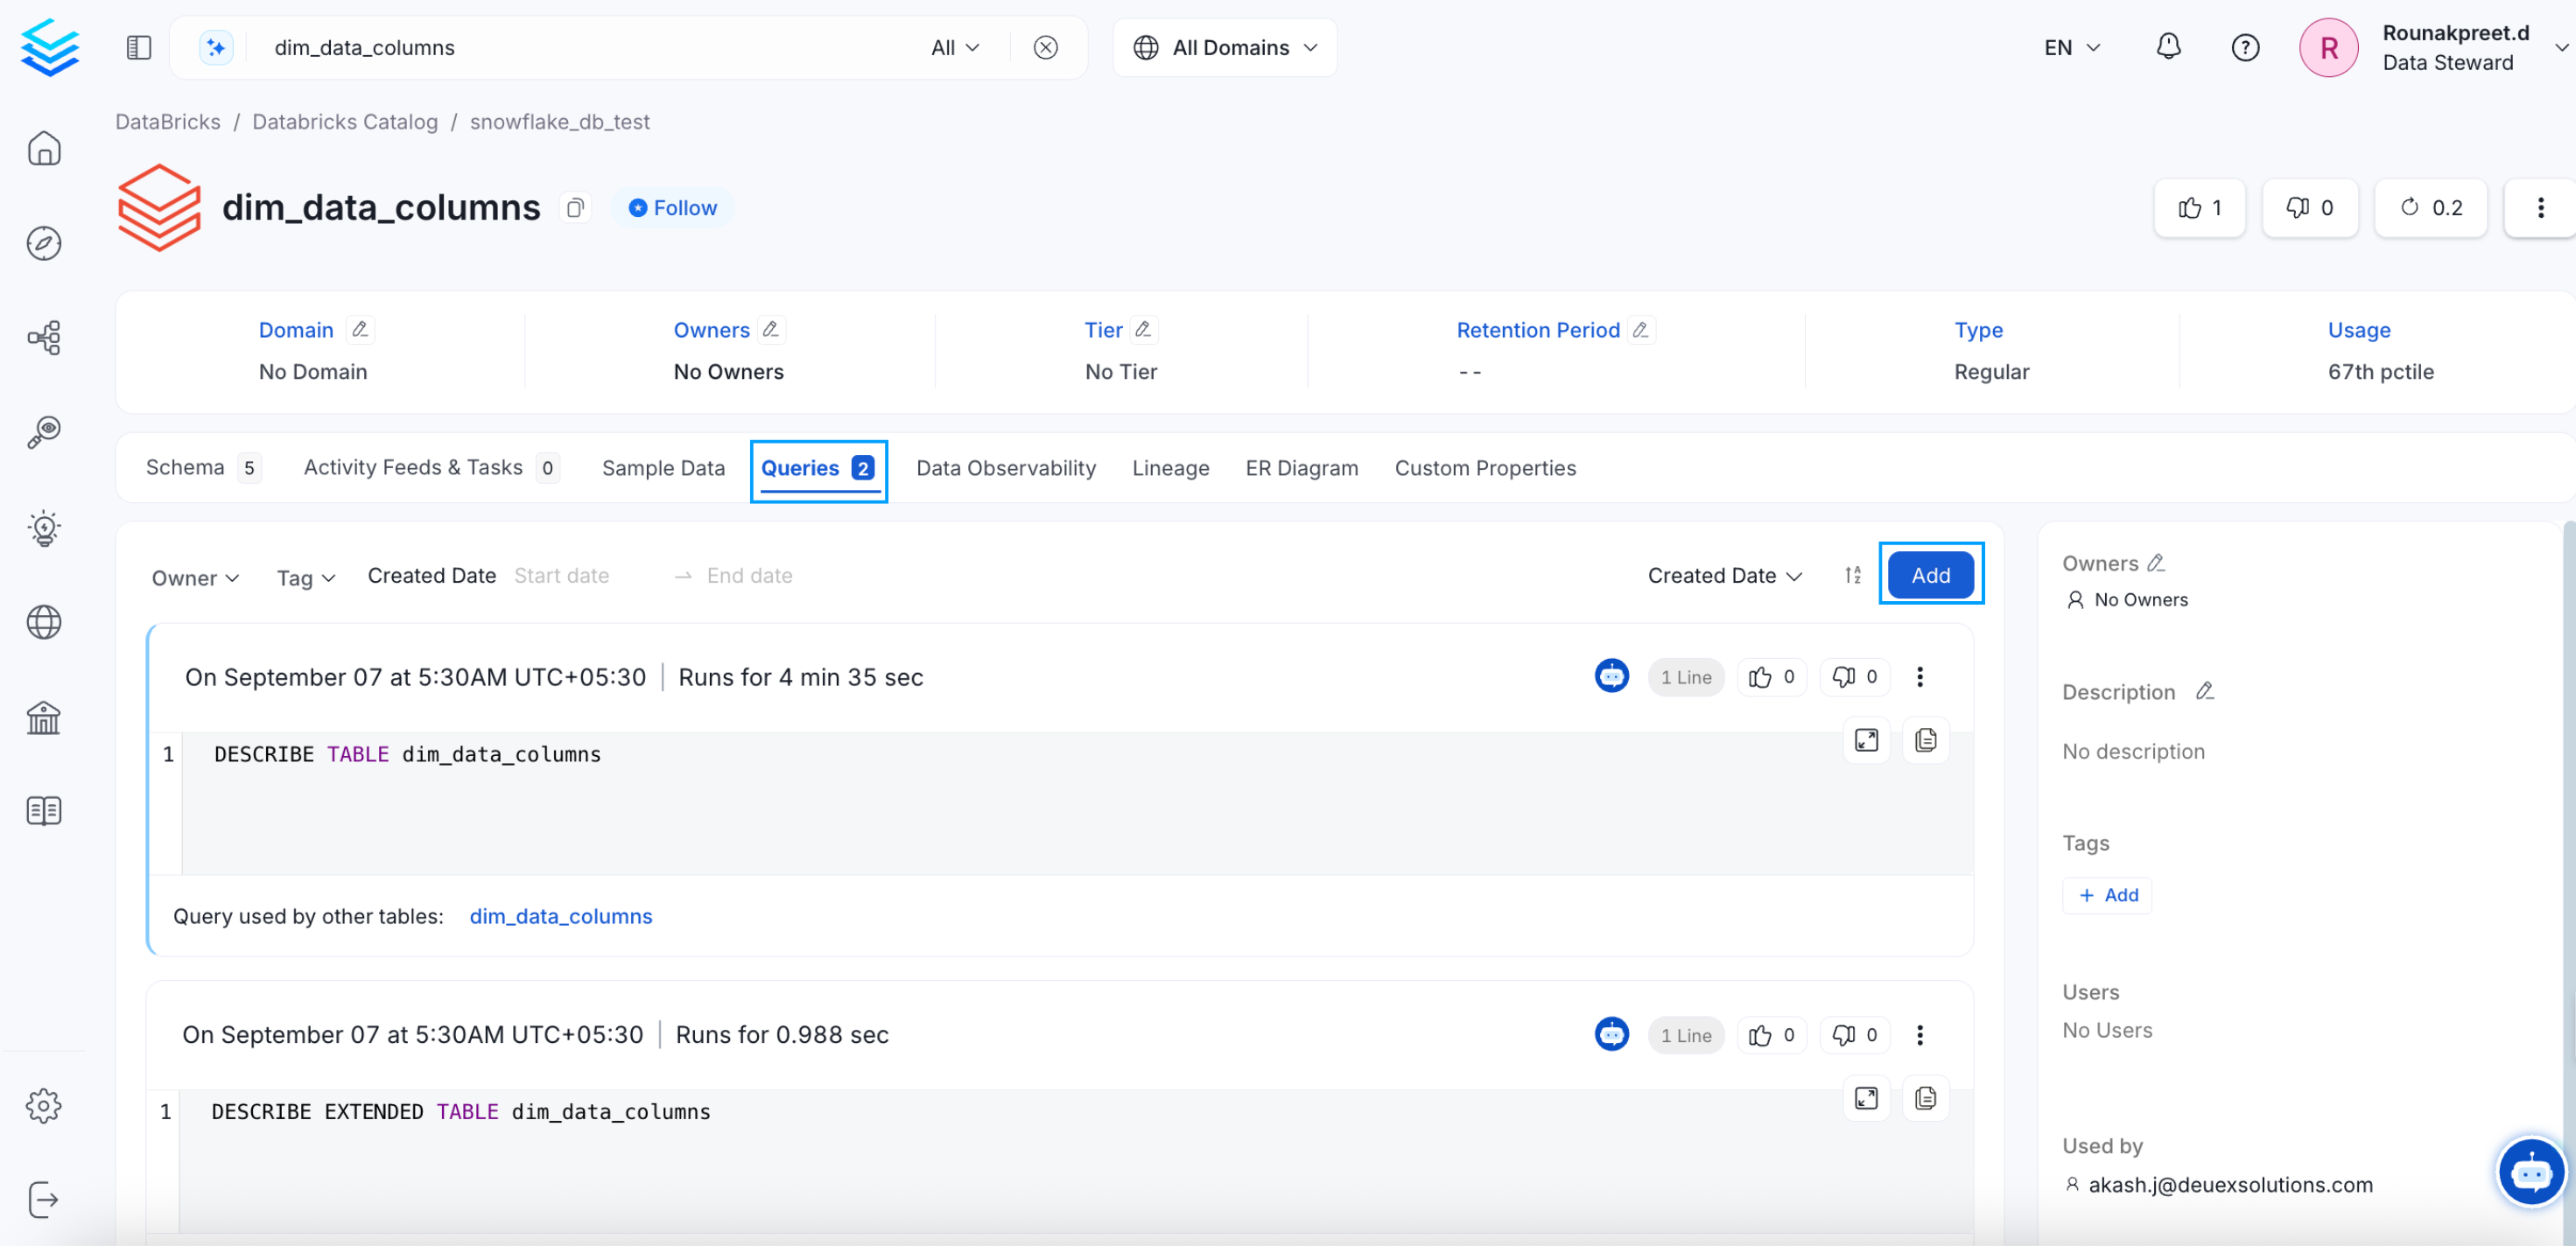
Queries Tab
Profiler & Data Quality Tab
The Profiler & Data Quality tab is displayed only for Tables. It has three sub-tabs for Table Profile, Column Profile, and Data Quality. The Profiler brings in details like number of rows and columns for the table profile alongwith the details of the data volume, table updates, and volume change. For the column profile, it brings in the details of the type of each column, the value count, null value %, distinct value %, unique %, etc. Data quality tests can be run on this sample data. We can add tests at the table and column level.
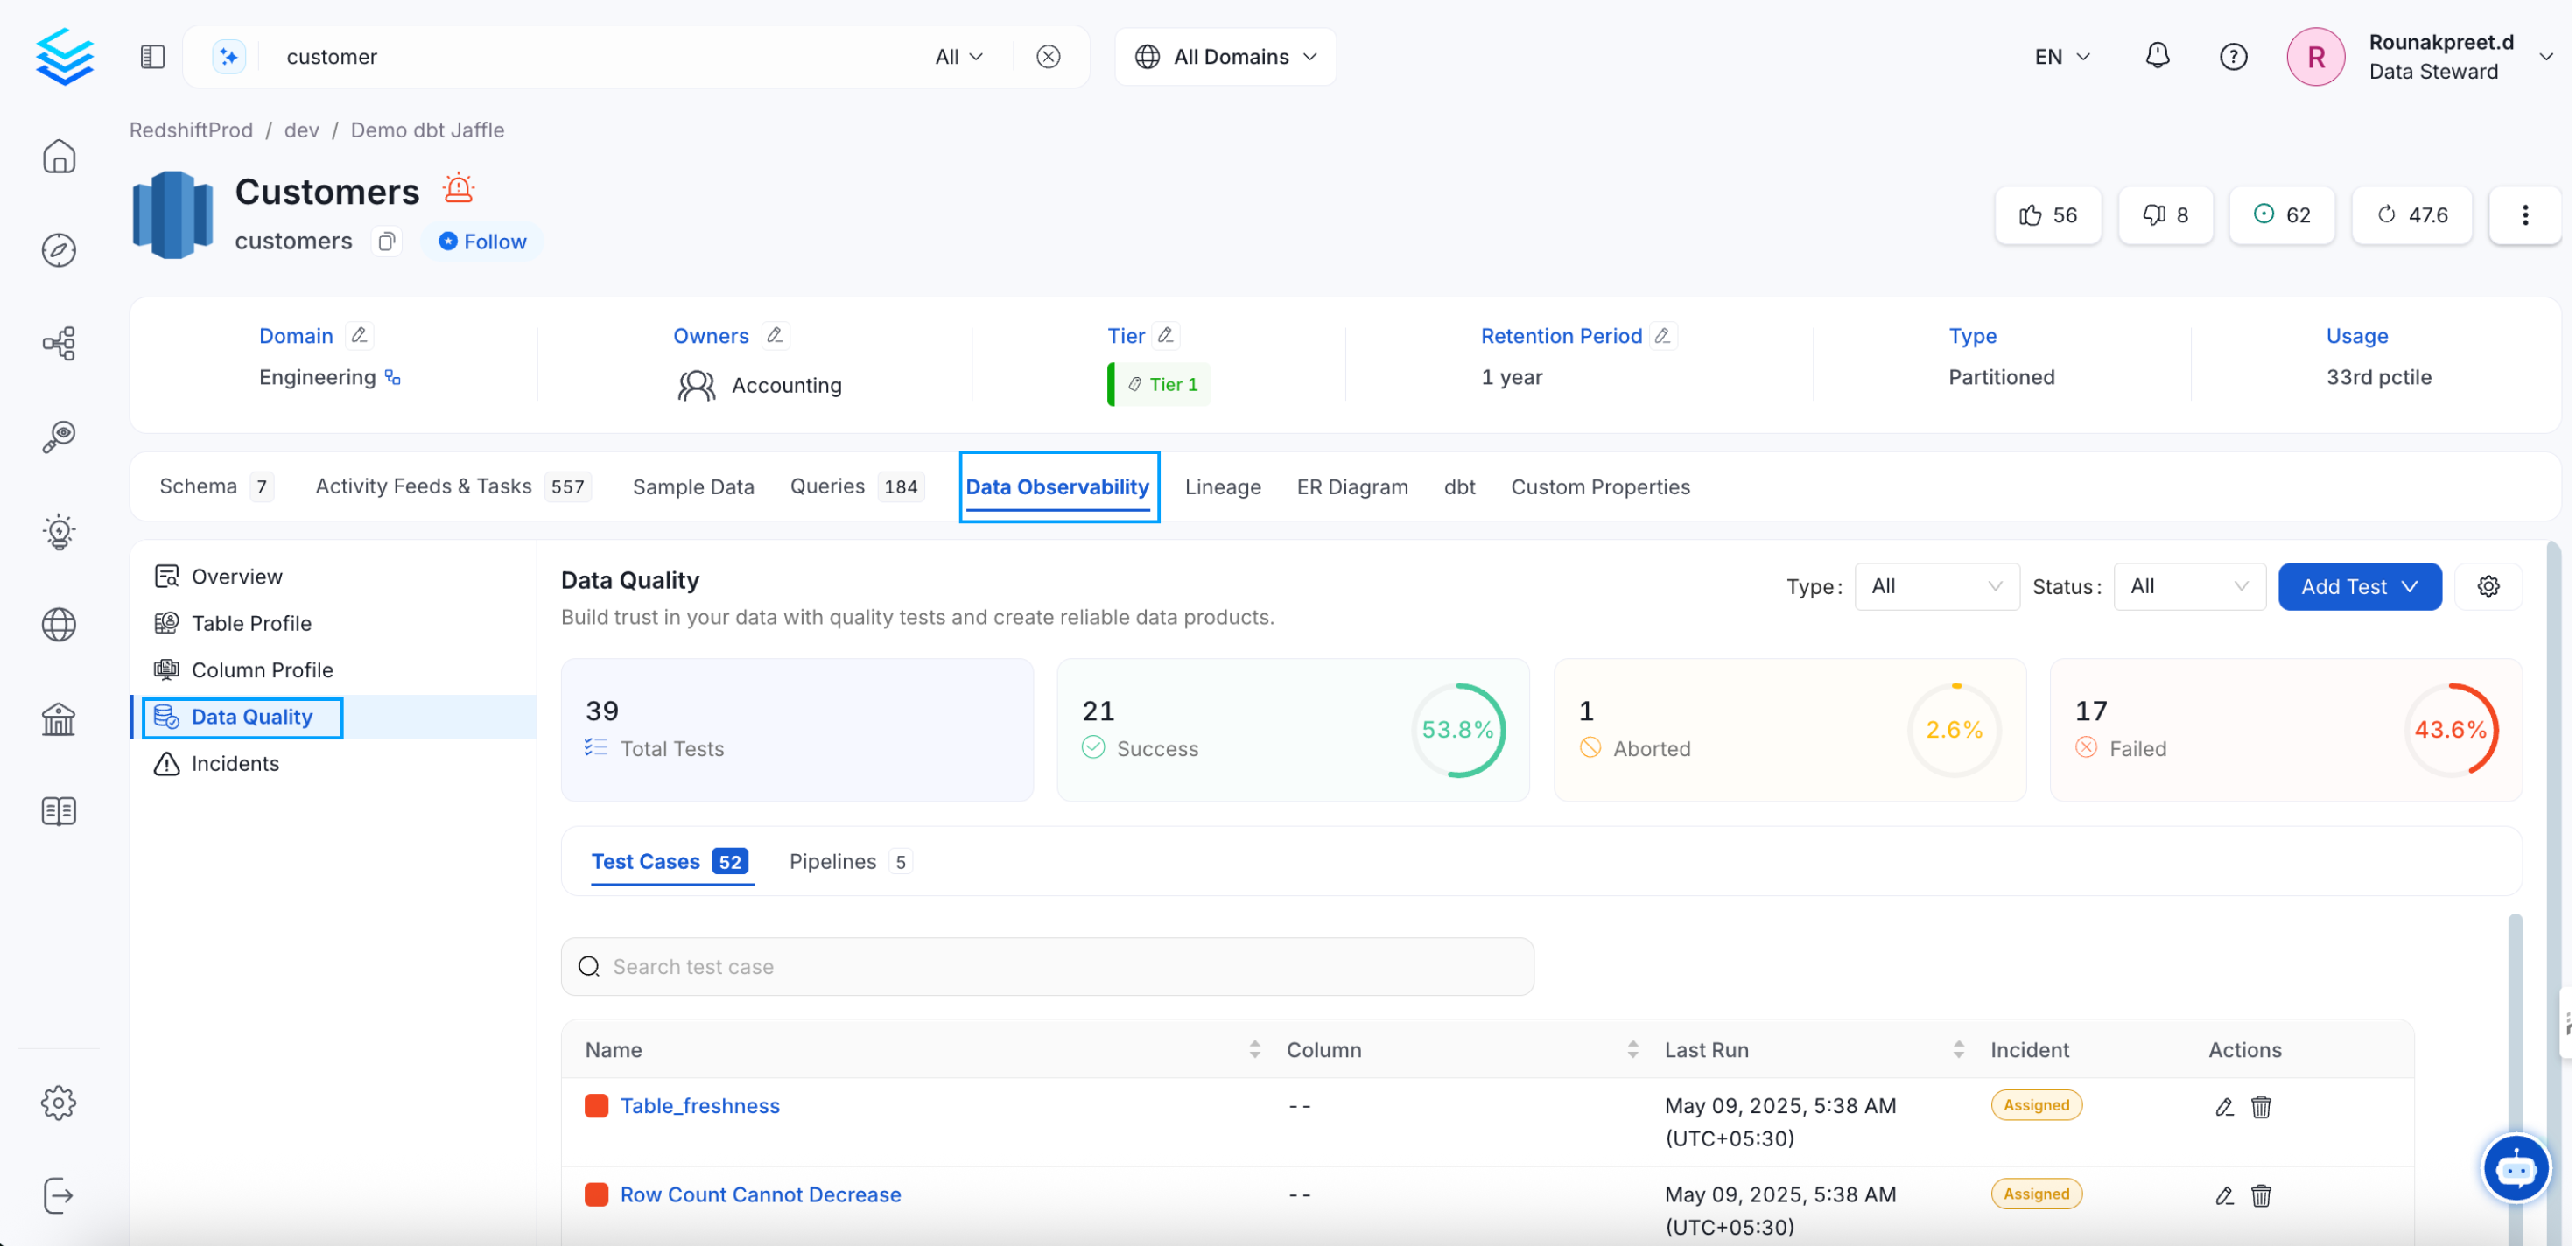
Profiler & Data Quality
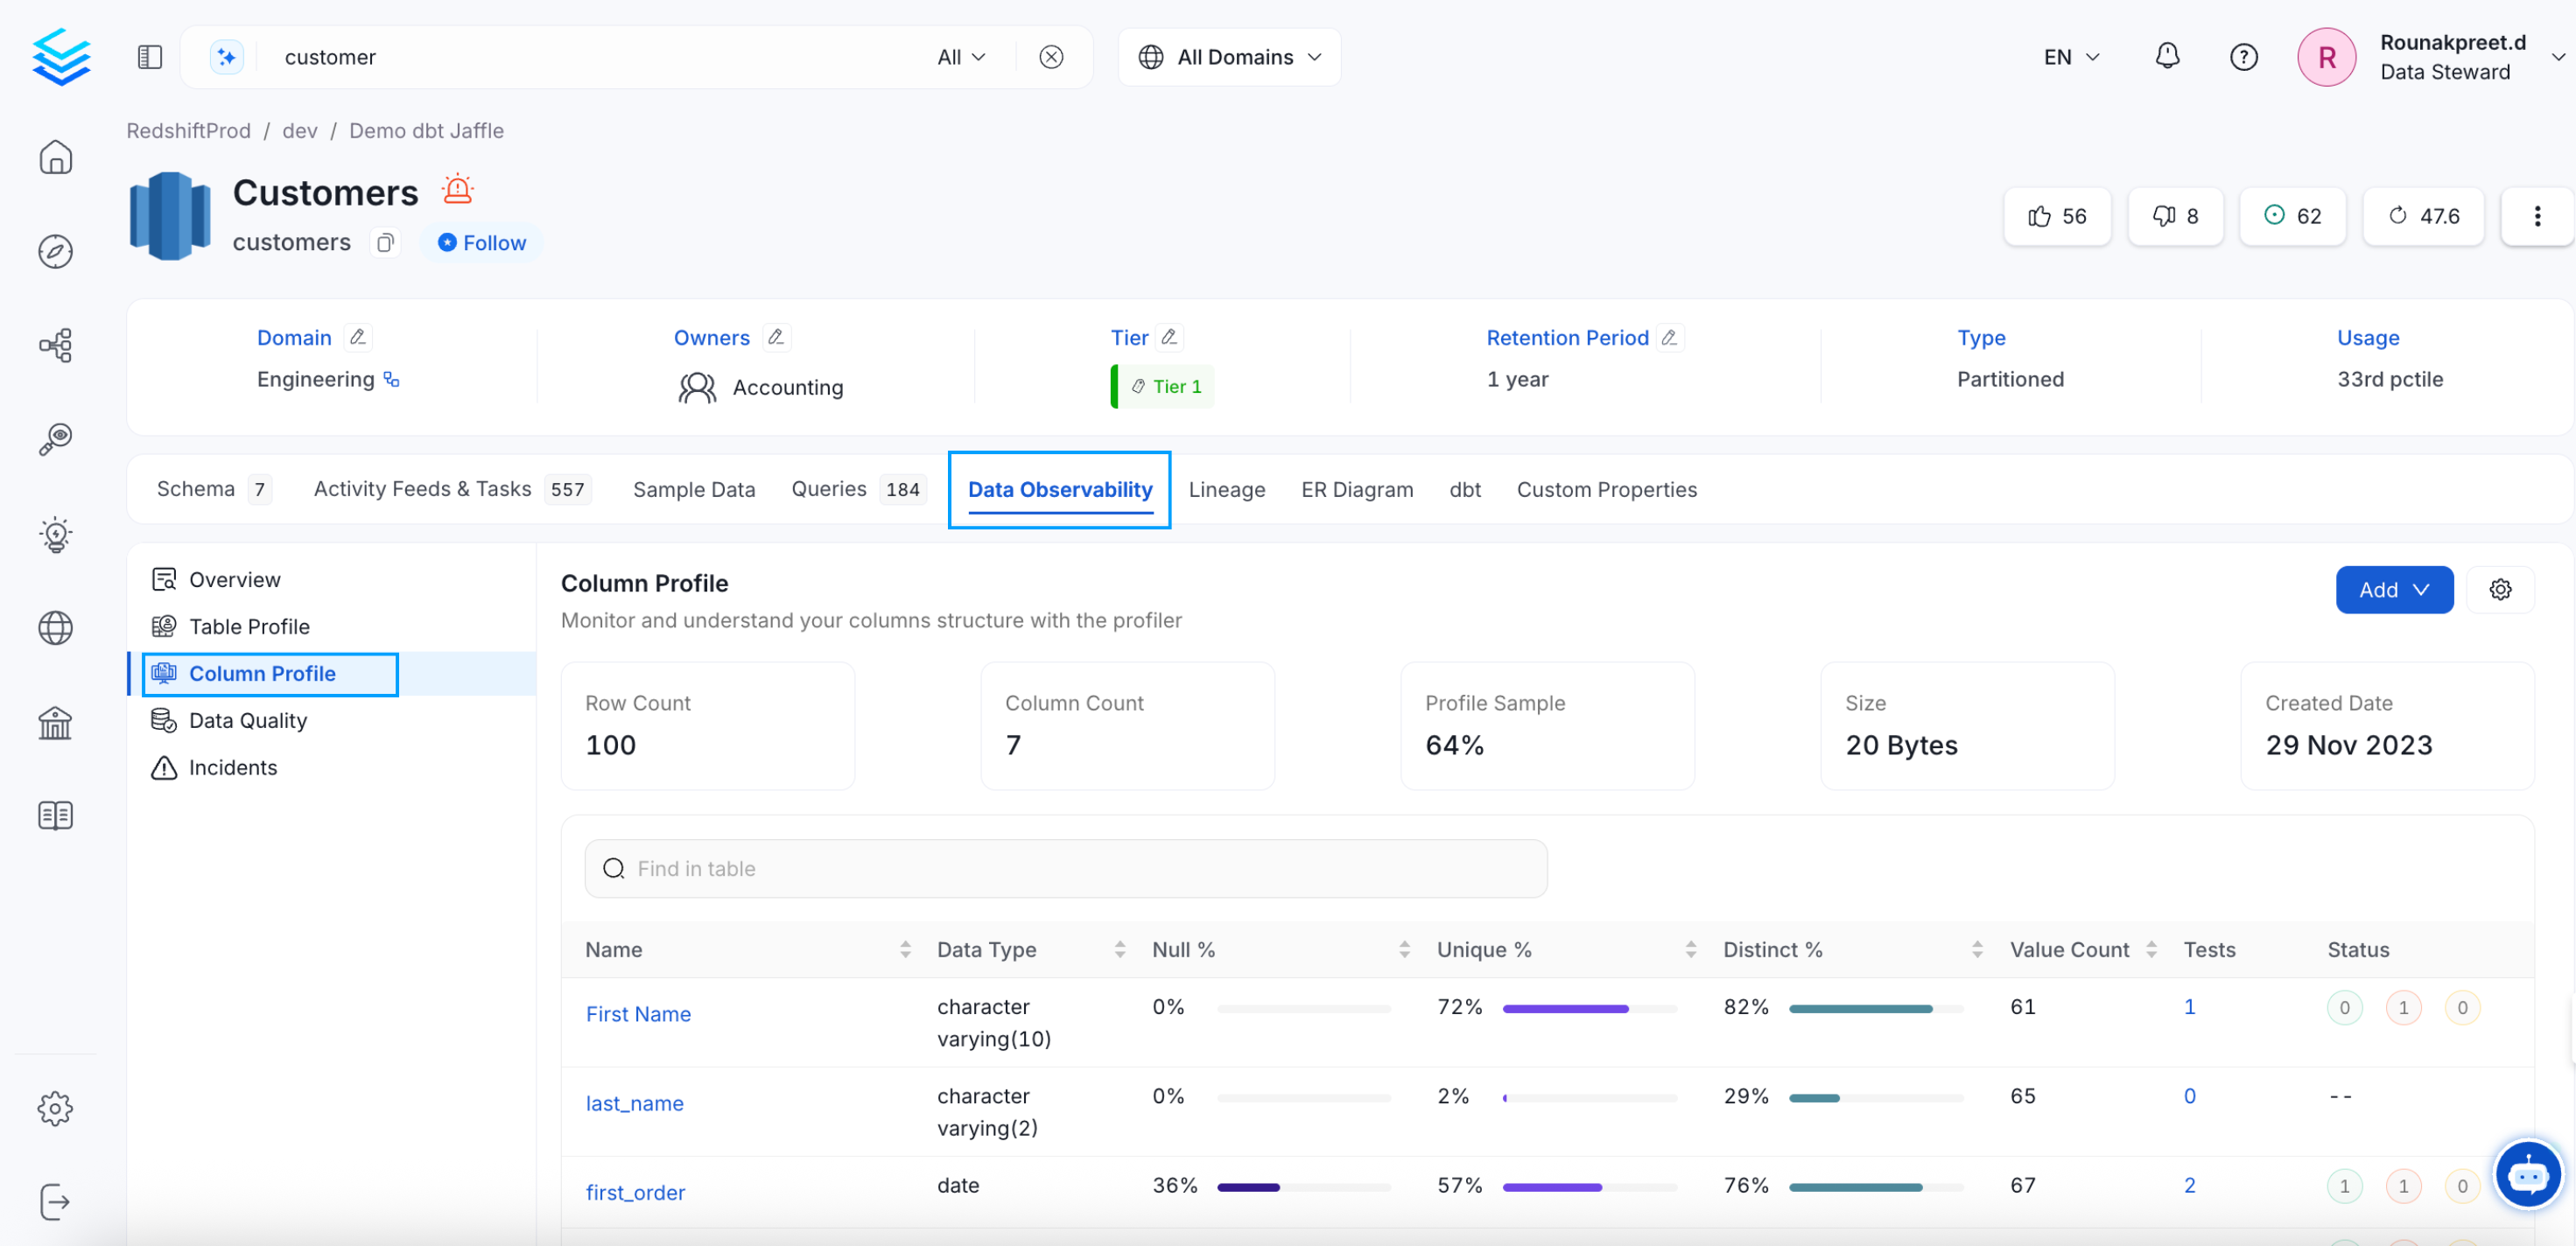
Column Profile of a Table
Check for more detailed information on the Profiler and Data Quality Tab.
Lineage Tab
The lineage tab is displayed for all types of data assets. The lineage view displays comprehensive lineage to capture the relation between the data assets. OpenMetadata UI displays end-to-end lineage traceability for the table and column levels. It displays both the upstream and downstream dependencies for each node.
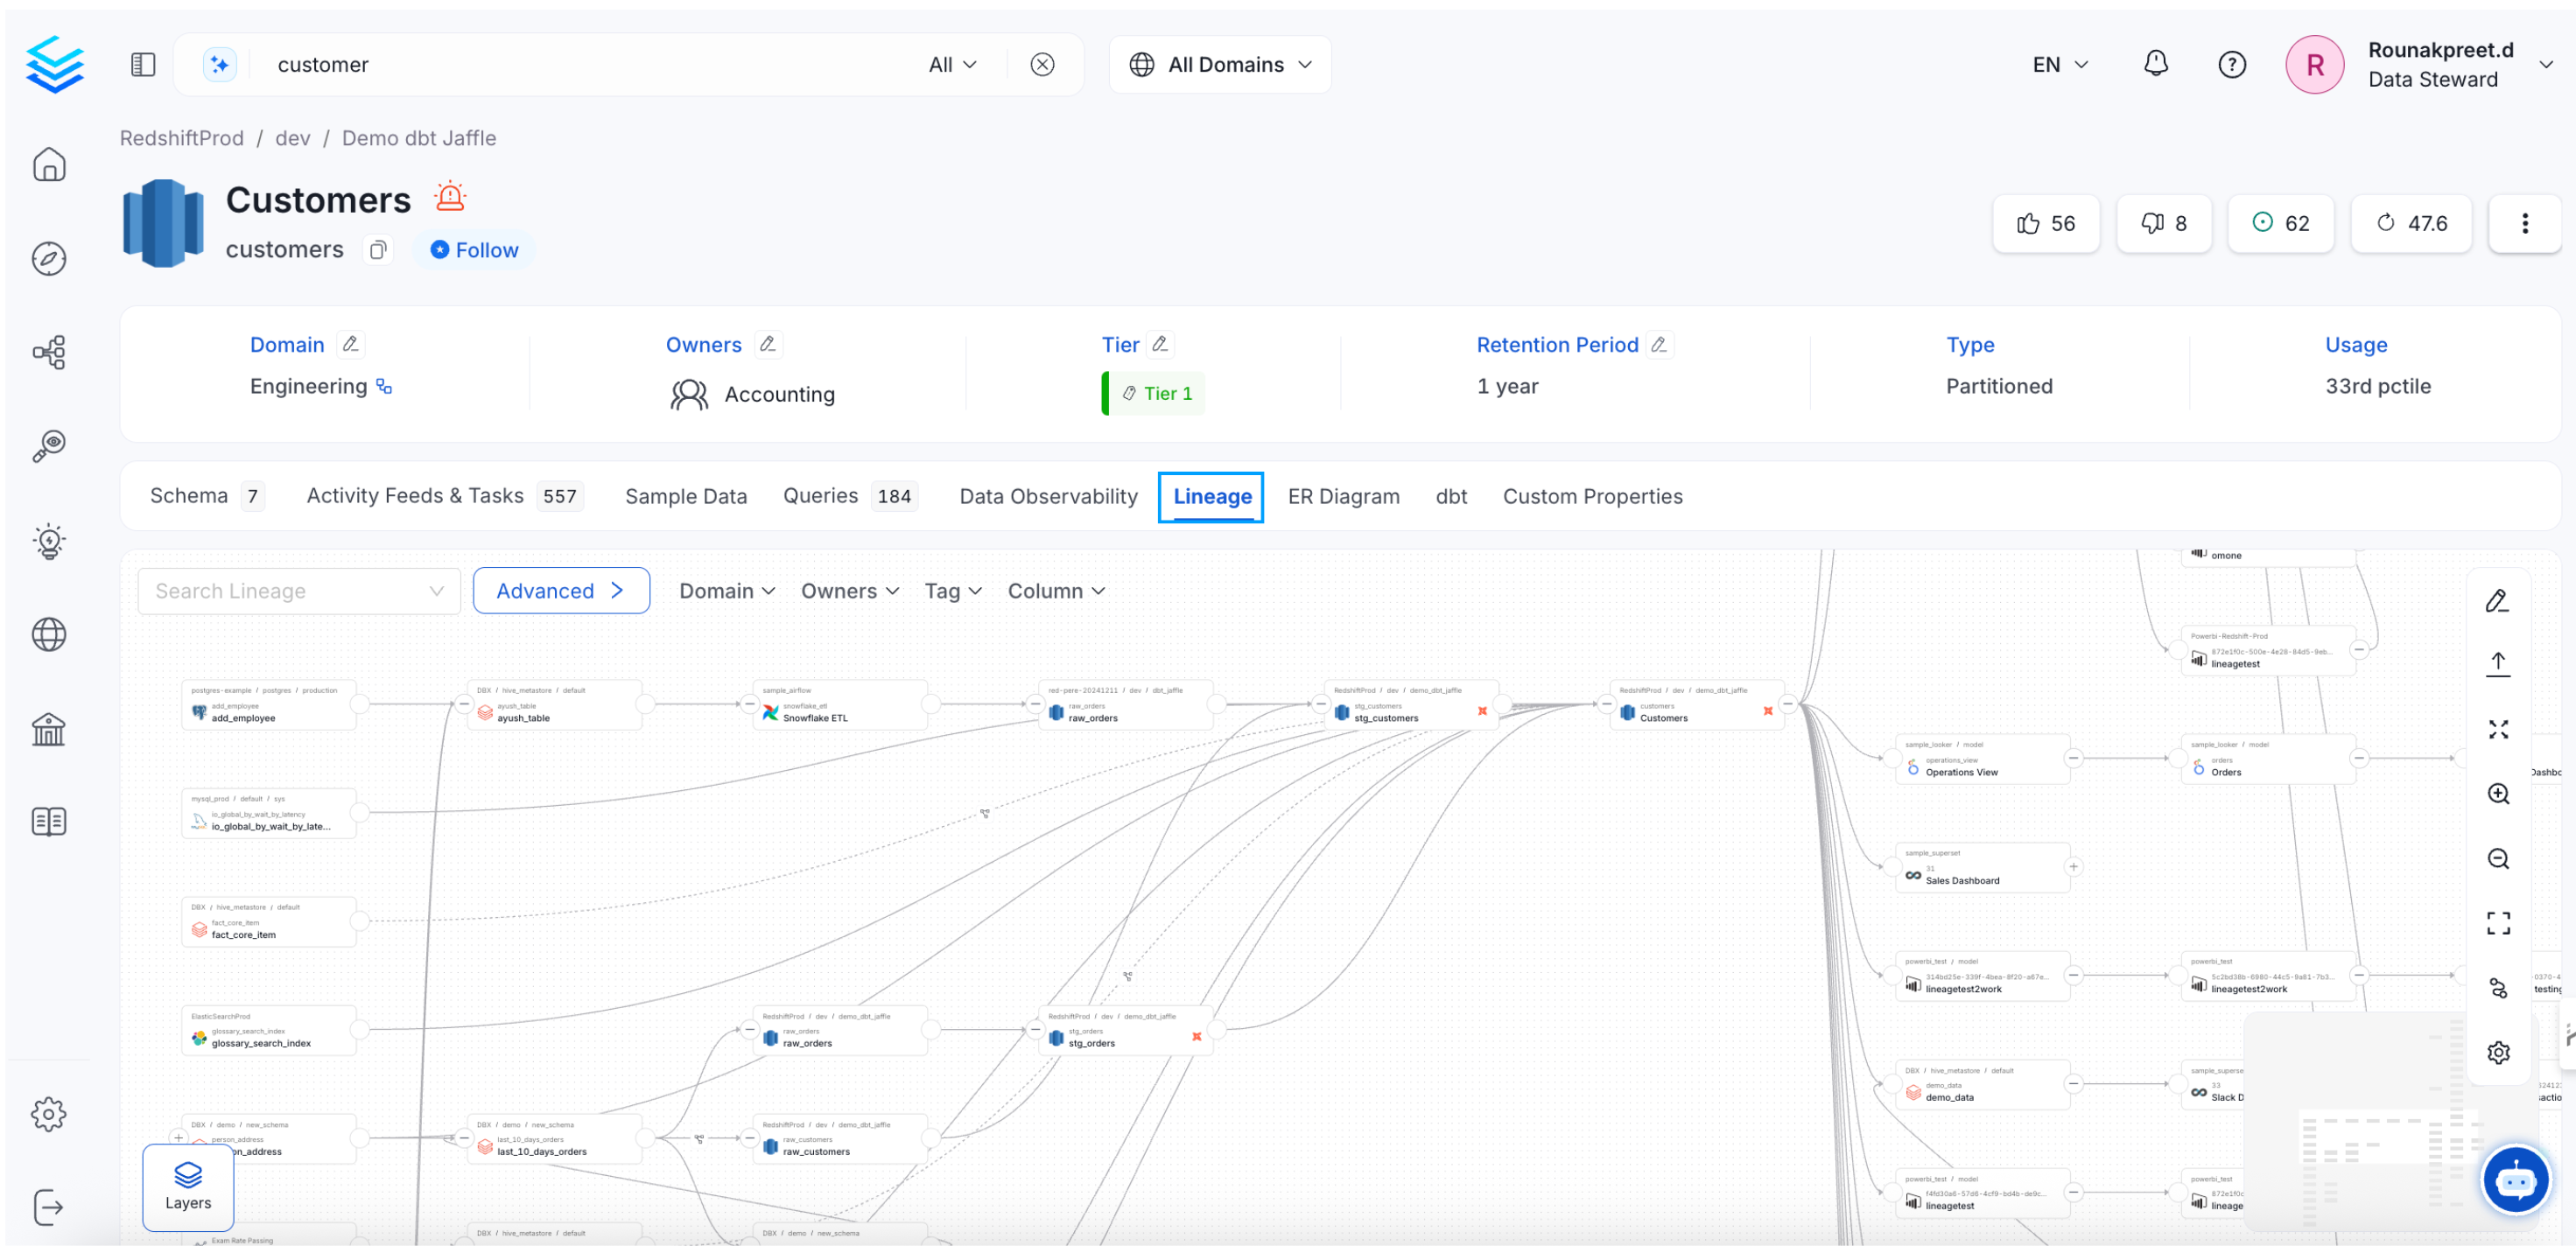
Comprehensive Lineage in OpenMetadata
Users can configure the number of upstreams, downstreams, and nodes per layer by clicking on the Settings icon. OpenMetadata support manual lineage. By clicking on the Edit icon, users can edit the lineage and connect the data assets with a no-code editor. Clicking on any data asset in the lineage view will display a preview with the details of the data asset, alongwith tags, schema, data quality and profiler metrics.
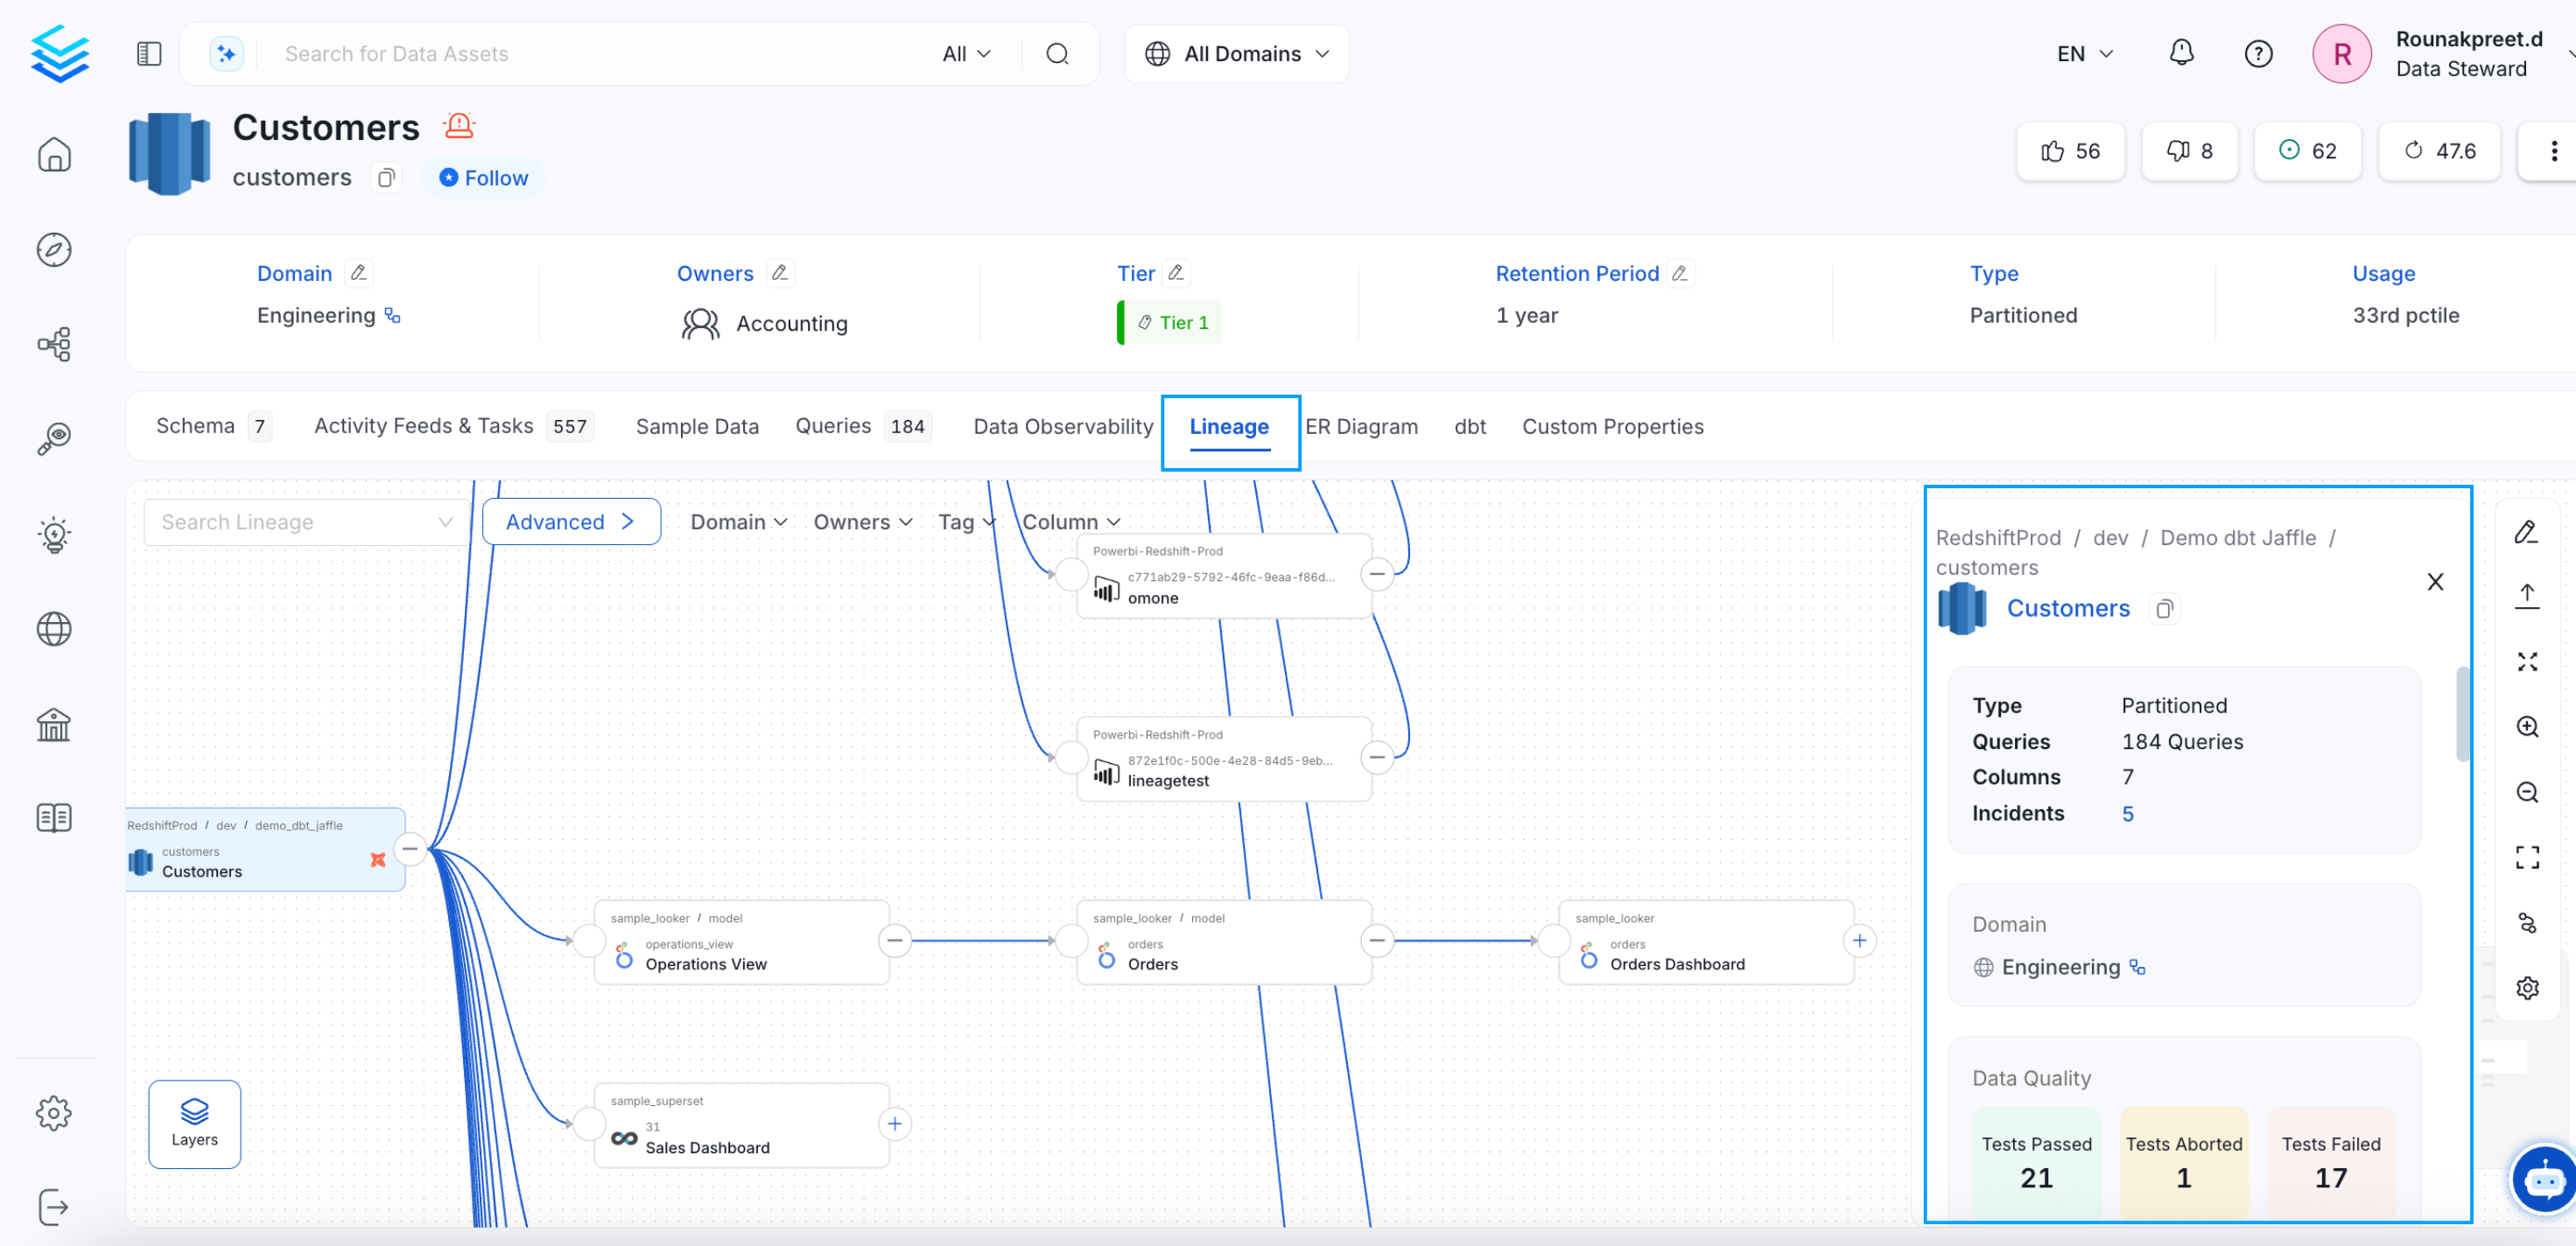
Data Asset Preview in Lineage Tab
Custom Properties Tab
OpenMetadata uses a schema-first approach. We also support custom properties for all types of data assets. Organizations can extend the attributes as required to capture custom metadata. The Custom Properties tab shows up for all types of data assets. User can add or edit the custom property values for the data assets from this tab. Learn How to Create a Custom Property for a Data Asset
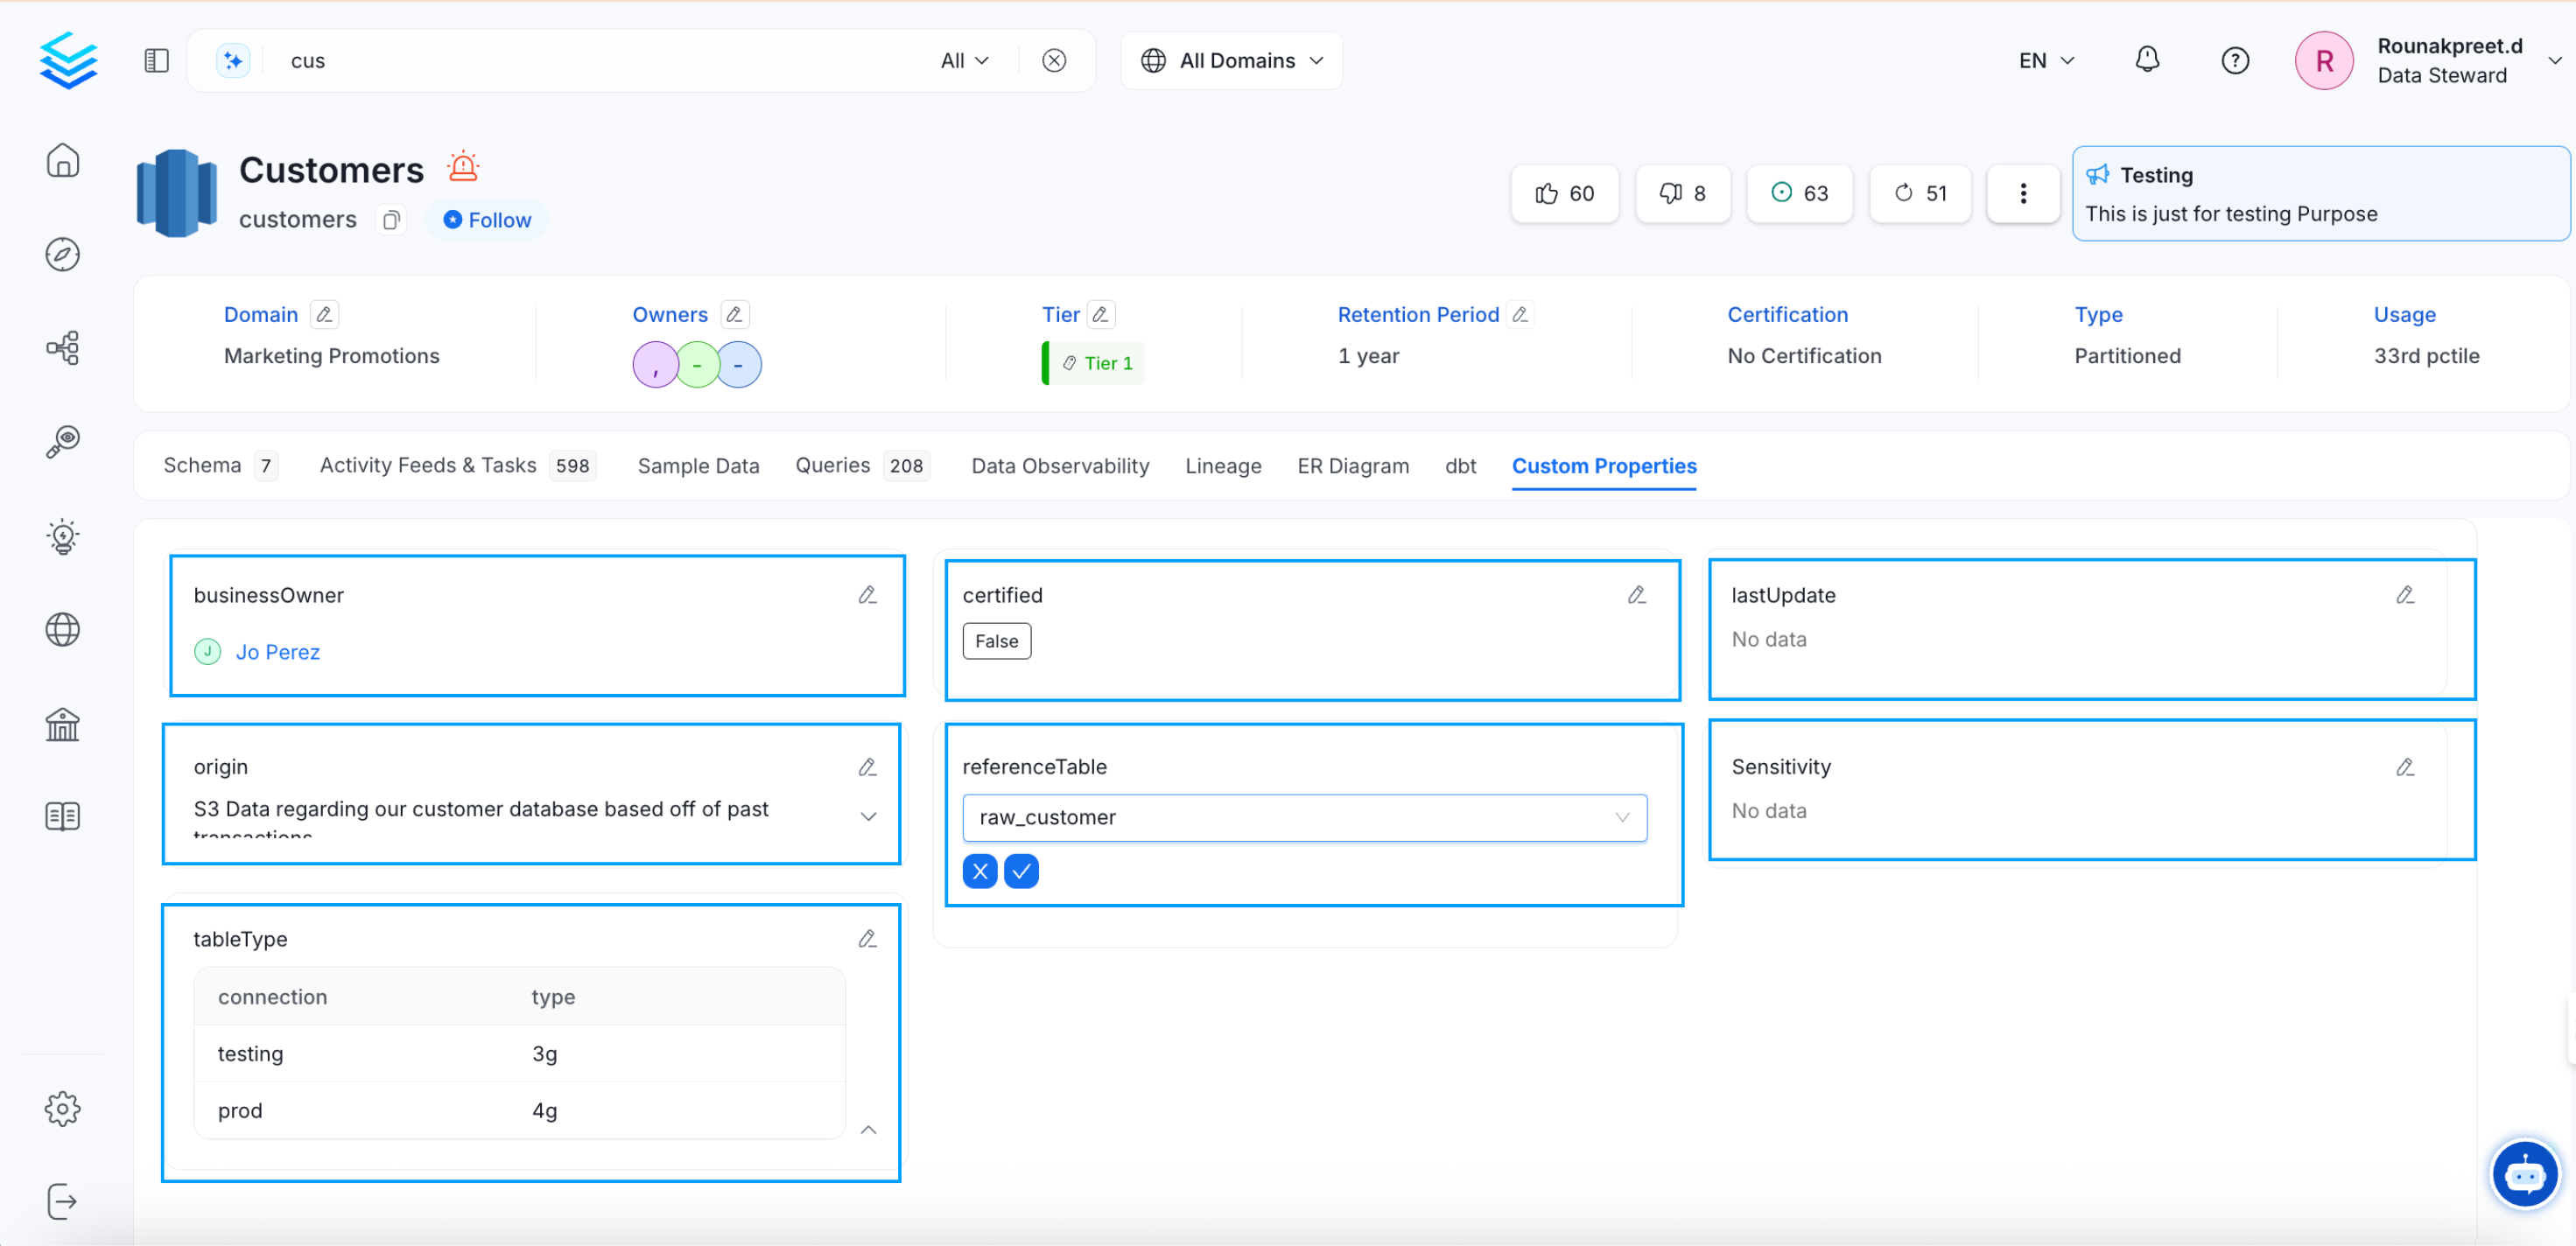
Enter the Value for a Custom Property
Config Tab
The Config tab is displayed only for Topics.
Details Tab
The Details tab is displayed only for Dashboards and ML Models. In case of Dashboards, the Details tab displays the chart name, type of chart, and description of the chart. It also displays the associated tags for each chart.
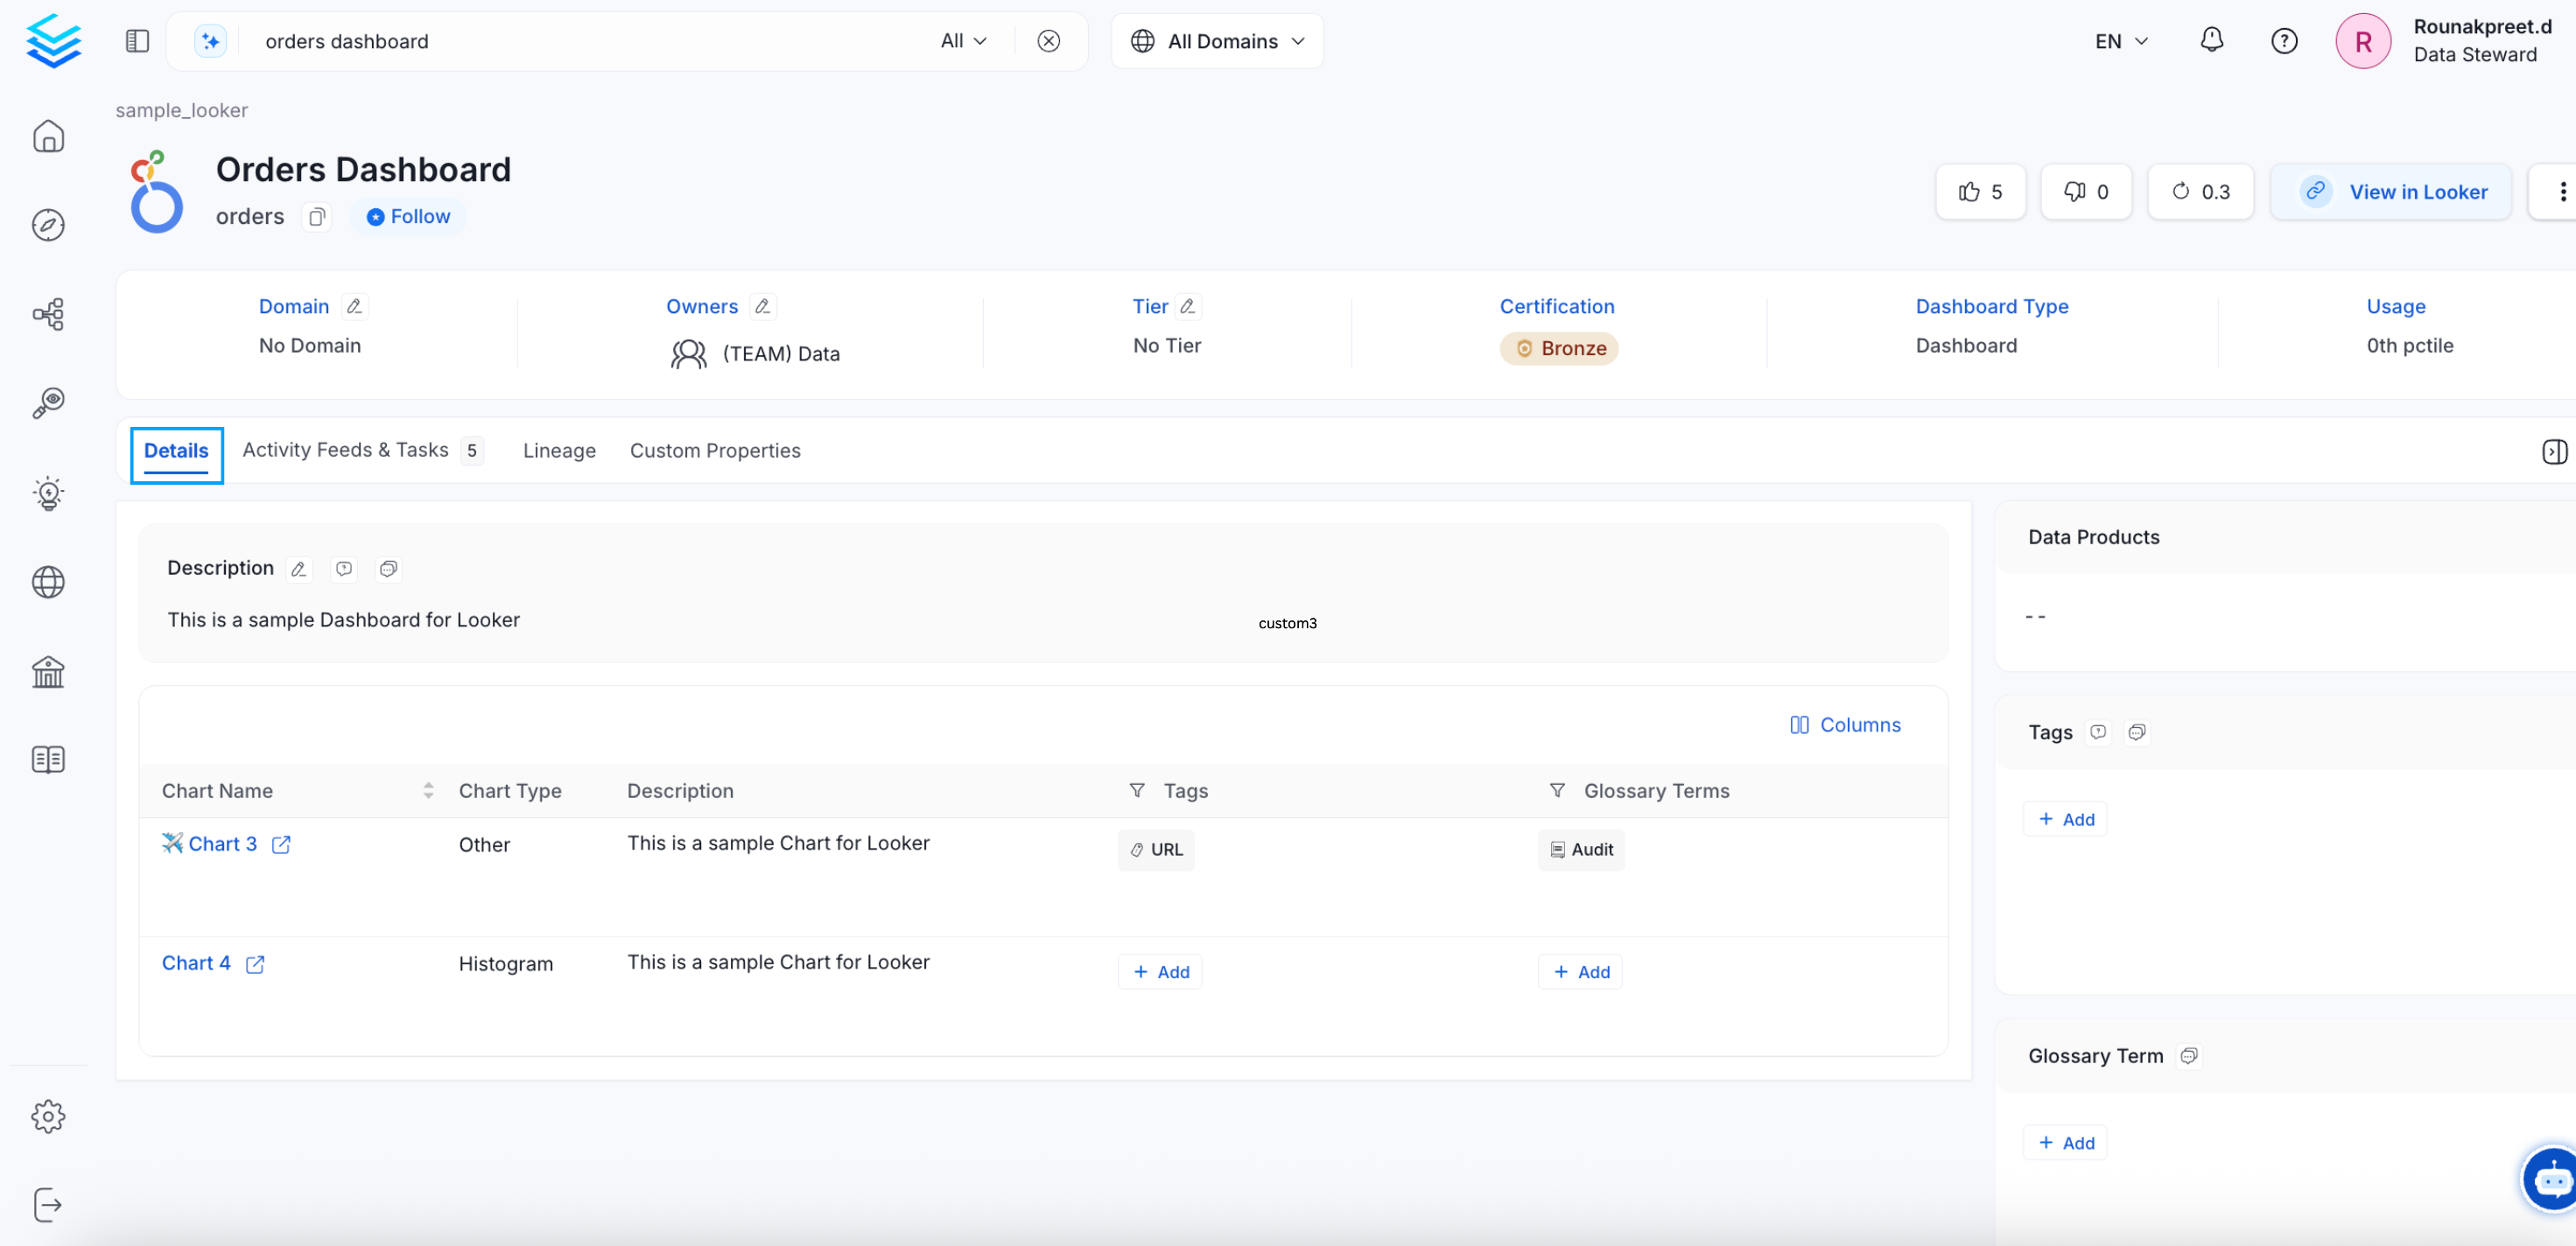
Dashboards: Details Tab
In case of ML Models, it displays the Hyper Parameters and Model Store details.
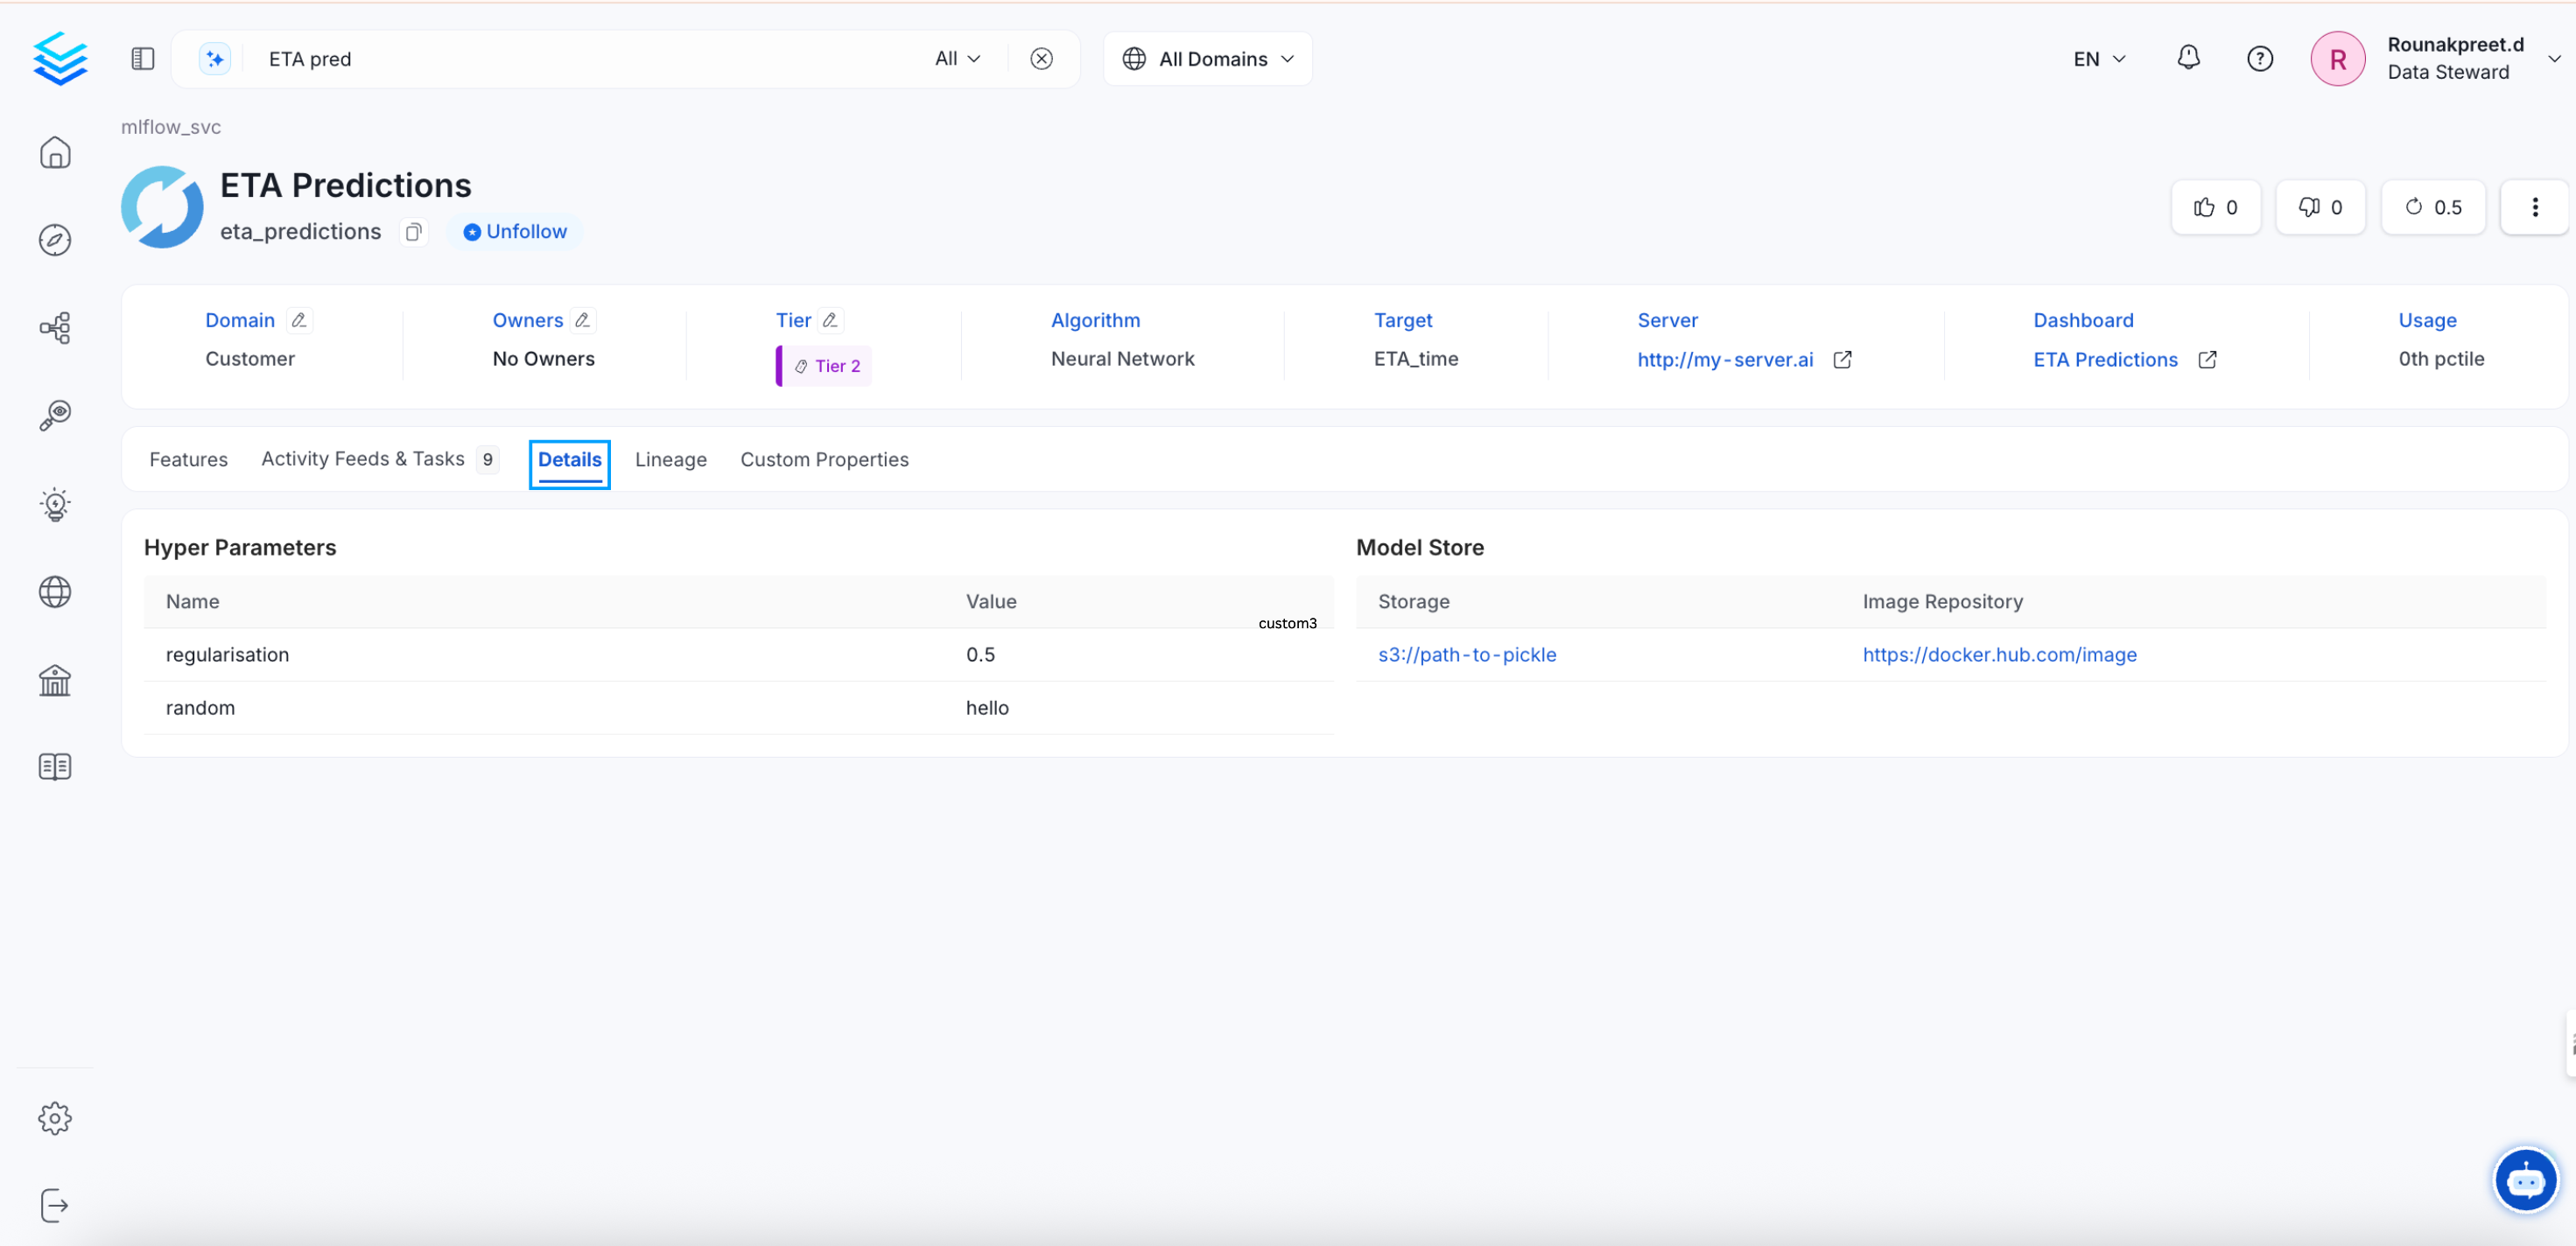
ML Models: Details Tab
Executions Tab
The Executions tab is displayed only for Pipelines. It displays the Date, Time, and Status of the pipelines. You can get a quick glance of the status in terms of Success, Failure, Pending, and Aborted. The status can be viewed as a Chronological list or as a tree. You can filter by status as well as by date.
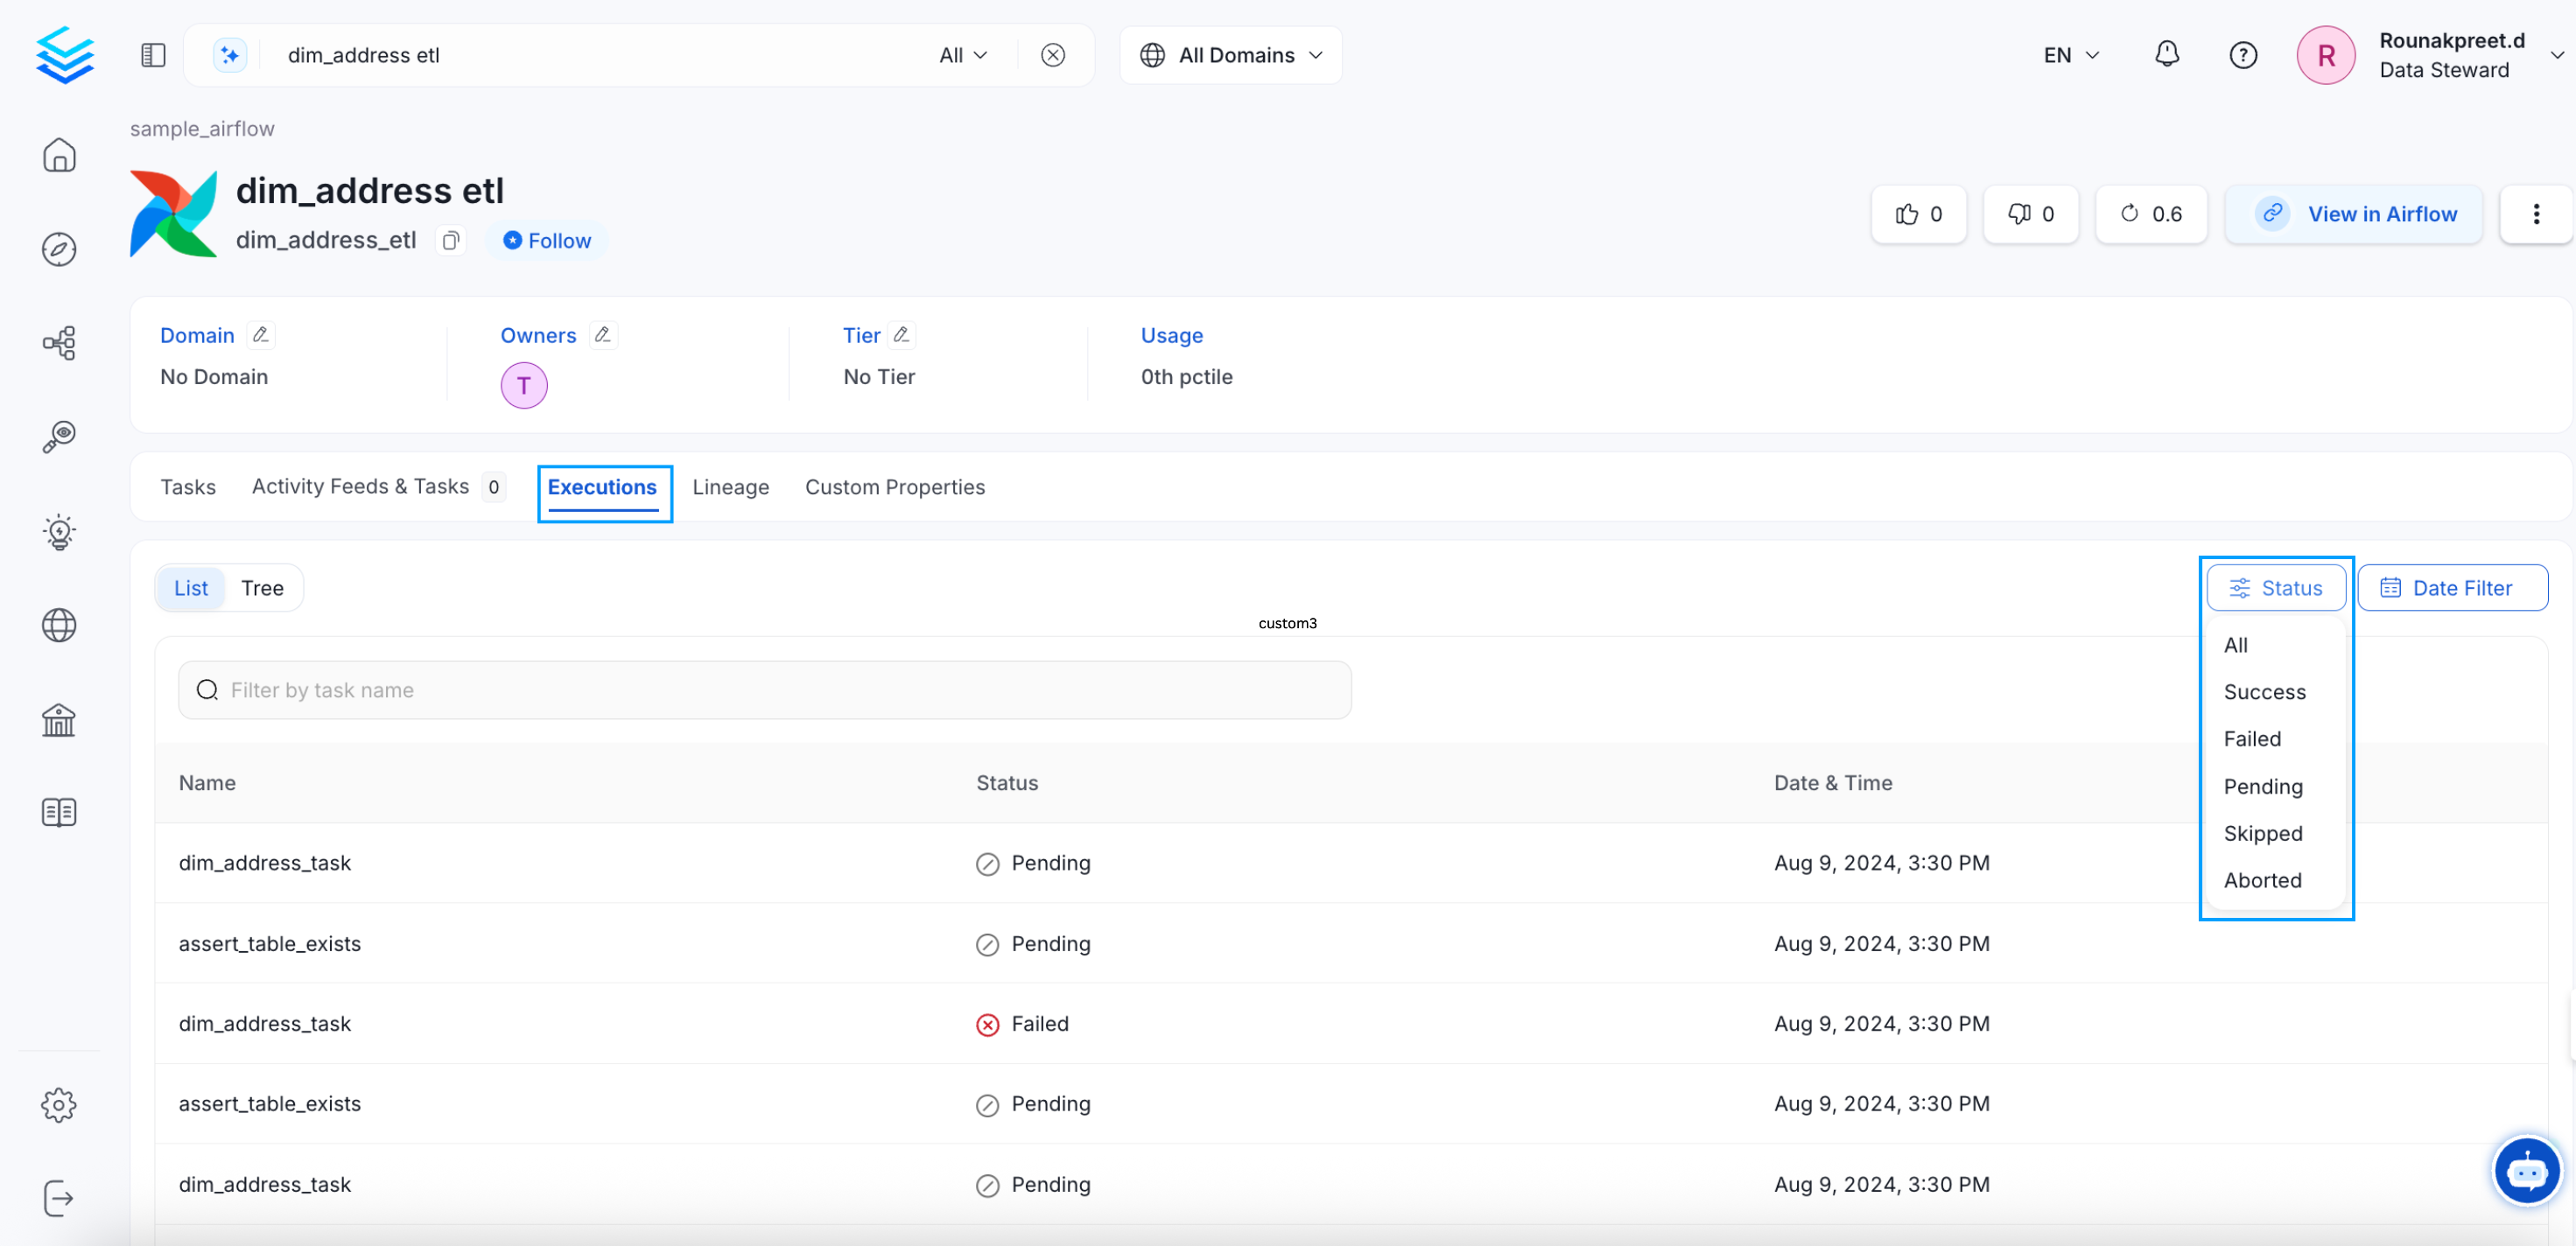
Pipelines: Executions Tab
Features Tab
The Features tab is displayed only for ML Models. It displays a Description of the ML Model, and the features that have been used. Each feature will have further details on the Type of feature, Algorithm, Description, Sources, and the associated Glossary Terms and Tags.
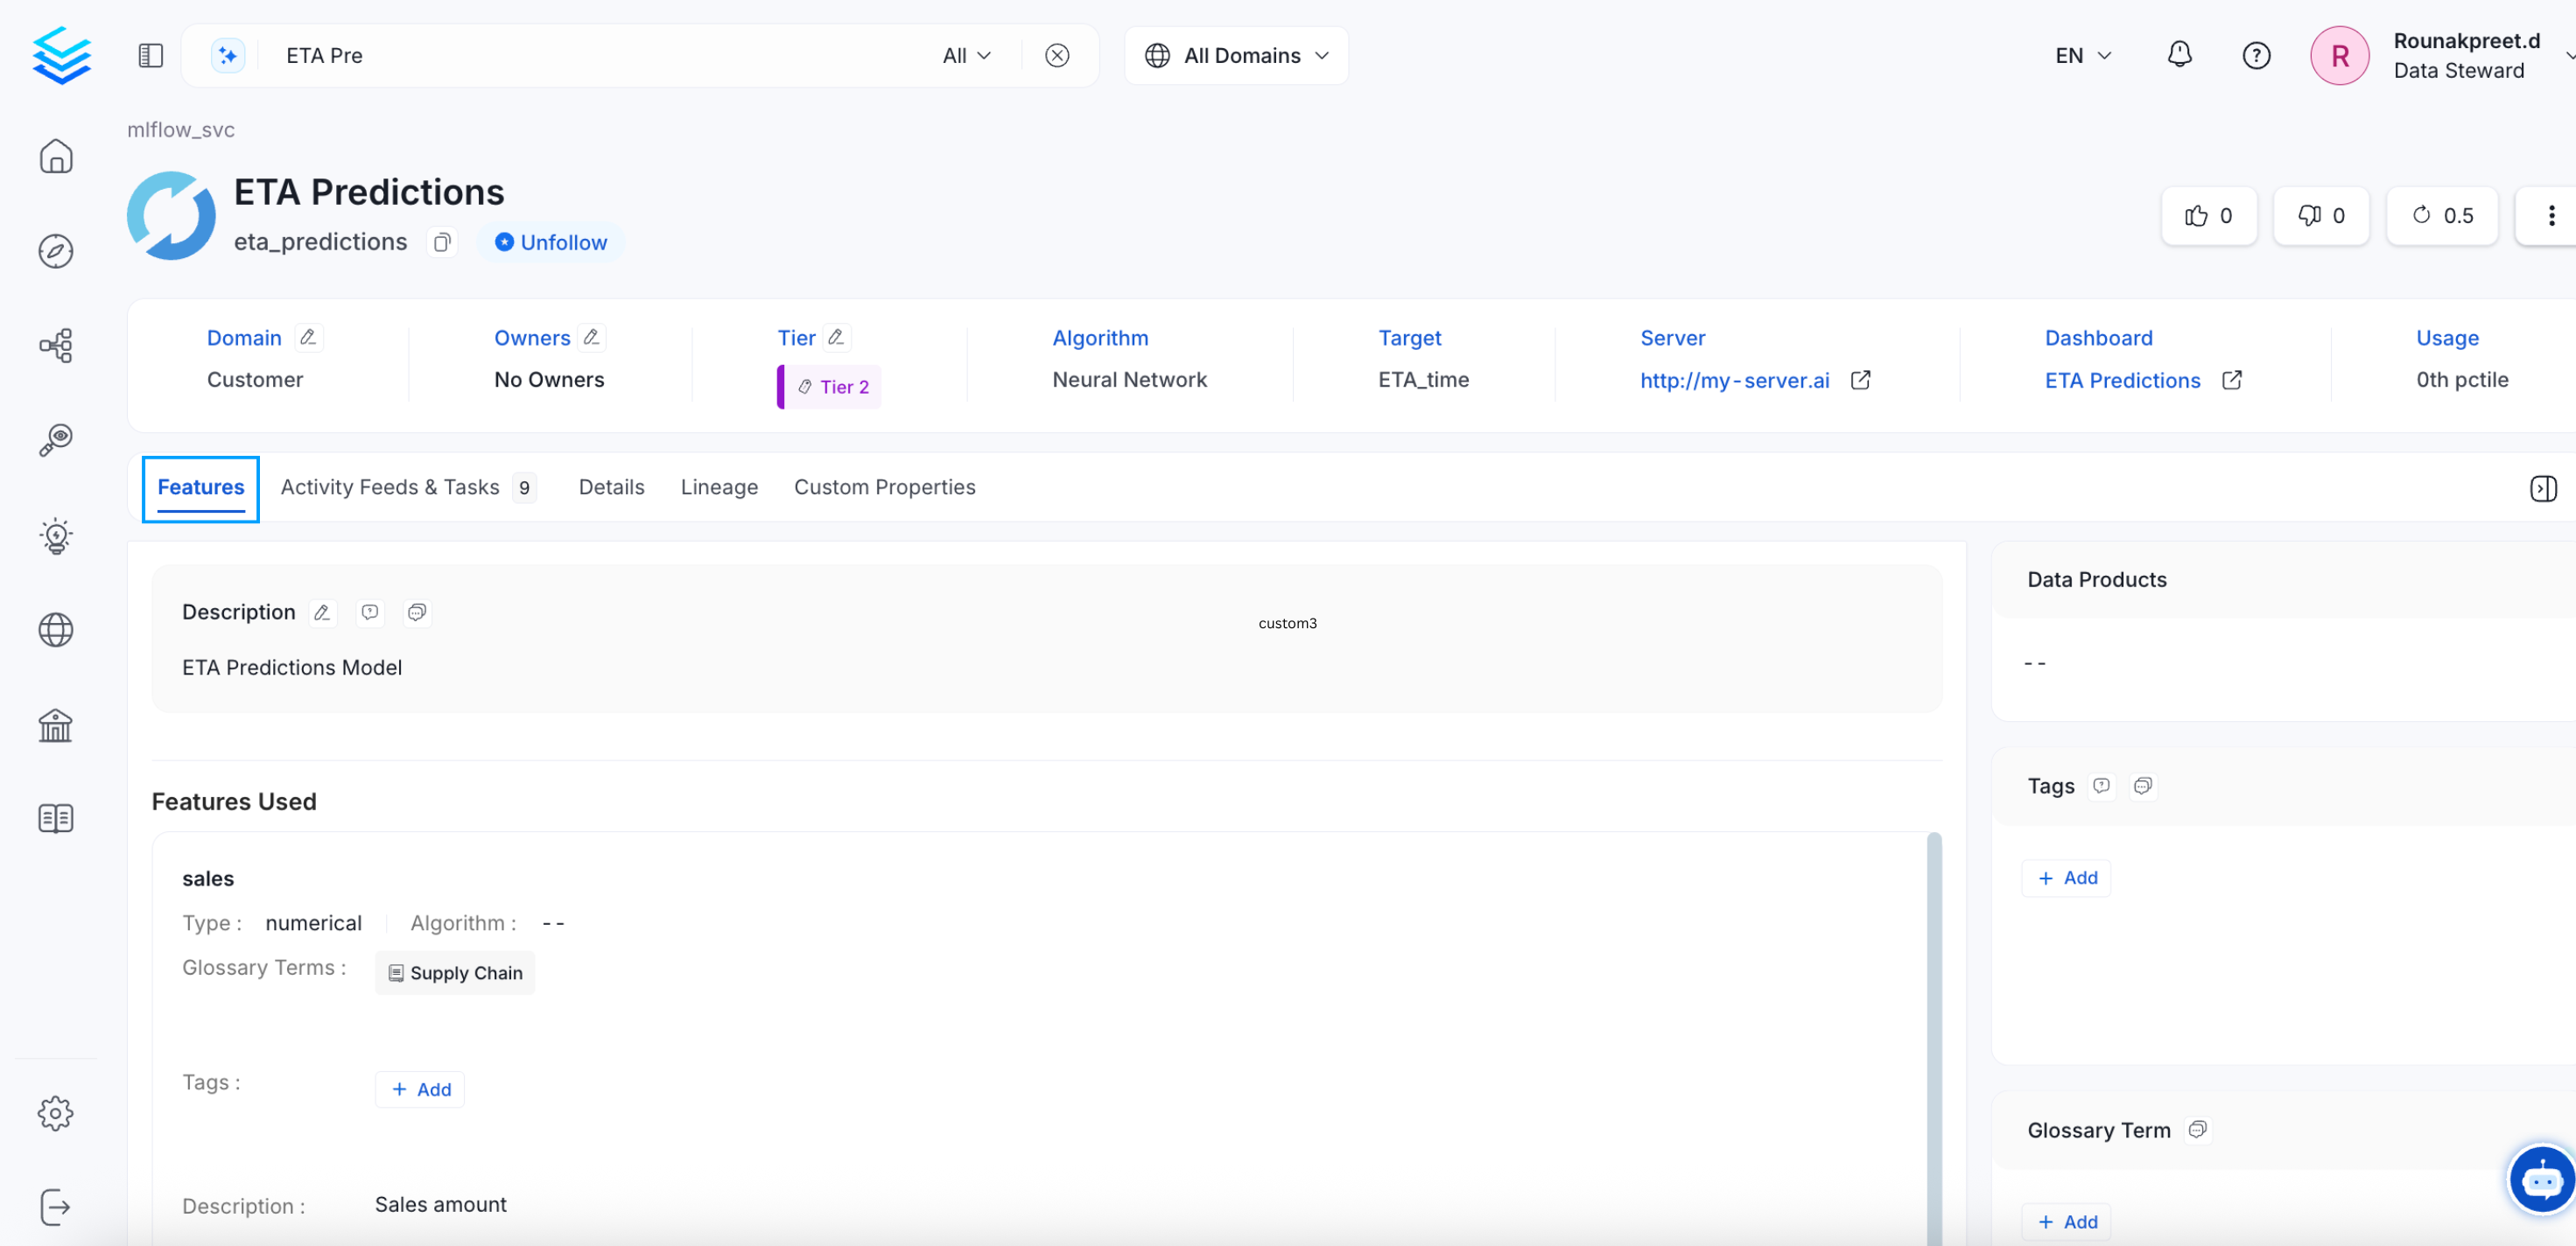
ML Models: Features Tab
Children Tab
The Children tab is displayed only for Containers.
Version History and Other Details
On the top right of the data asset details page, we can view details on:
- Tasks: The circular icon displays the number of open tasks.
- Version History: The clock icon displays the details of the version history in terms of major and minor changes.
- Follow: The star icon displays the number of users following the data asset.
- Share: Users can share the link to the data asset.
- Announcements On clicking the ⋮ icon, users can add announcements.
- Rename: On clicking the ⋮ icon, users can rename the data asset.
- Delete: On clicking the ⋮ icon, users can delete the data asset.
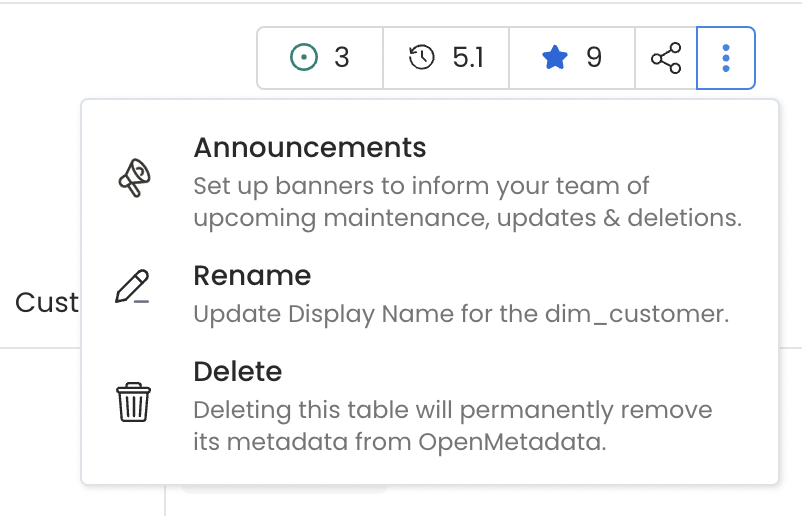
Version History and Other Details
Describe your data assets using Markdown